
Machine Learning Applied to Wine + Data: How to Work with 200 Million DTC Records
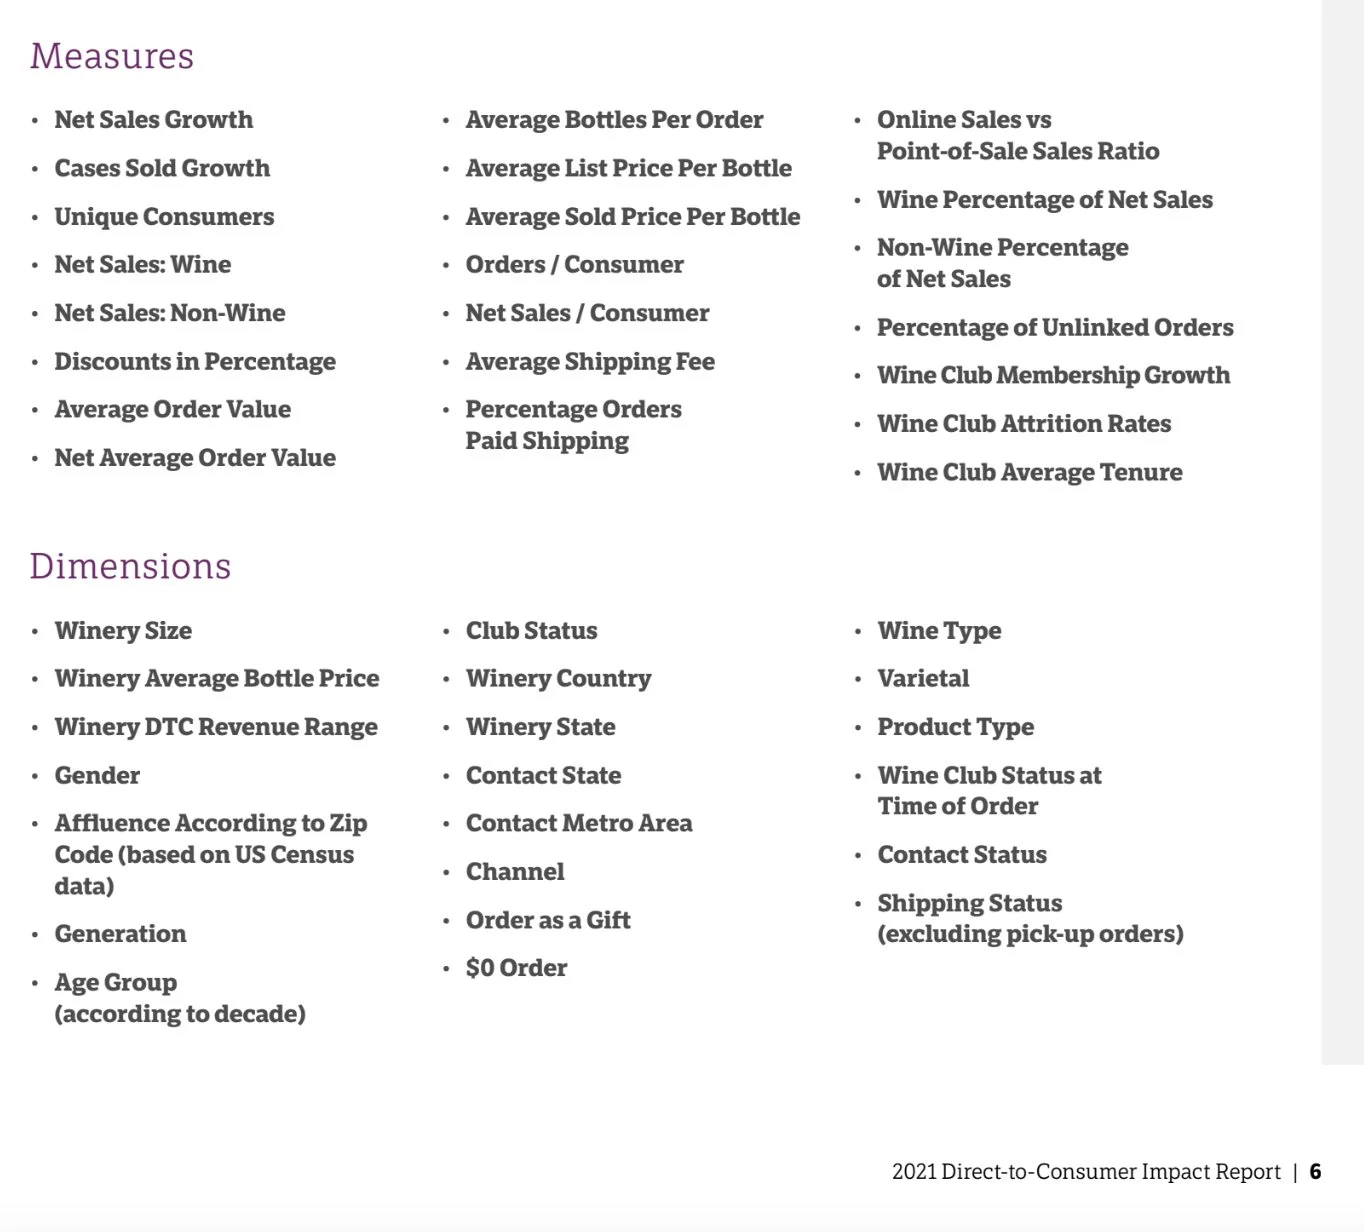
IMAGE CREDIT: All the Levers: Page 6 of the WineDirect x Enolytics 2021 DTC Impact Report
It was a pretty even split.
Of the content during the WineDirect x Enolytics webinar this week, that is. Andrea Smalling (WineDirect’s CMO) and I spent about half of the time on takeaways and applications from the 2021 DTC Impact Report, using prepared slides.
The other half of the time, though, we opened up to Q&A from the audience.
The audience (maybe you were there!) could have asked anything, and I loved tuning into what was on their minds about this report.
This week I’d like to hover over two of those questions, and offer more thorough replies.
Question: You mentioned Machine Learning (ML) and other data analysis tools used to create insights. Could you speak to more of the process behind how the data was aggregated and insights gathered?
Our Response: ML is applied to many parts of the Report analysis. It’s actually extrapolated from the original Enolytics DTC platform itself for individual wineries.
For example, we use ML to predict Club members who are risk of leaving the Club, which helps wineries decrease their attrition rates. We use many levers to calculate this, such as months spent in the membership funnel, specific club (each club has their own churn rate), demographic data, purchasing behavior, etc.
Another ML example is our forecasting functionality for all main KPIs, or Key Performance Indicators. In this case, ML enables wineries to forecast, within certain margins and conditions, performance over the next one to two years of business.
Question: Can levers be pulled for individual, smaller wineries and others interested in deep dives into specific data points?
Our Response: Absolutely, and our plans with WineDirect are to execute those “slices” of the data according to specific data points like Channel (Tasting Room vs Wine Club vs Website sales, for example), Varietal (Cabernet Sauvignon vs Pinot Noir vs Chardonnay) and Demographics (consumer purchases in Brooklyn vs Miami vs Seattle).
In the meantime, individual wineries who use Enolytics for their DTC programs can access this functionality 24/7 with their own data that’s refreshed every single day.
It’s pretty cool.
The best part? You don’t have to know how Machine Learning works. All you have to do is benefit from it. You can always schedule a demo and get started.
In case you missed the webinar live but would like to see it, please let me know. It was recorded and we’d be happy to share the link.
As always, thank you for reading and for your interest in this report.
Cathy