The Future of DTC Wine Sales is Changing—Here’s How to Stay Ahead
Wineries that thrive in 2025 will be those who can instantly assess their business health, predict customer behavior, and act on opportunities before competitors even see them. No other DTC analytics platform on the market offers you the insights needed to:
Spot wine club members at risk of leaving and take action to retain them.
Identify profitable customer segments for revenue-driving campaigns.
Target high-value upsell opportunities with advanced basket analysis.
Improve budgeting and forecasting with real-time insights.
Equip every team — from wine club managers to marketing, sales, finance, and the C-suite — with actionable data that accelerates growth.
With Enolytics, you’re not just managing DTC sales—you’re outperforming industry averages year after year.
The Only DTC Wine Analytics Platform With 360° Data Power
Enolytics DTC wine data tools deliver advanced reporting, proprietary algorithms, and integrated forecasting tools that competitors simply don’t have—all proven to drive revenue and outperform industry benchmarks.
Explore Enolytics for DTC
Modules
-
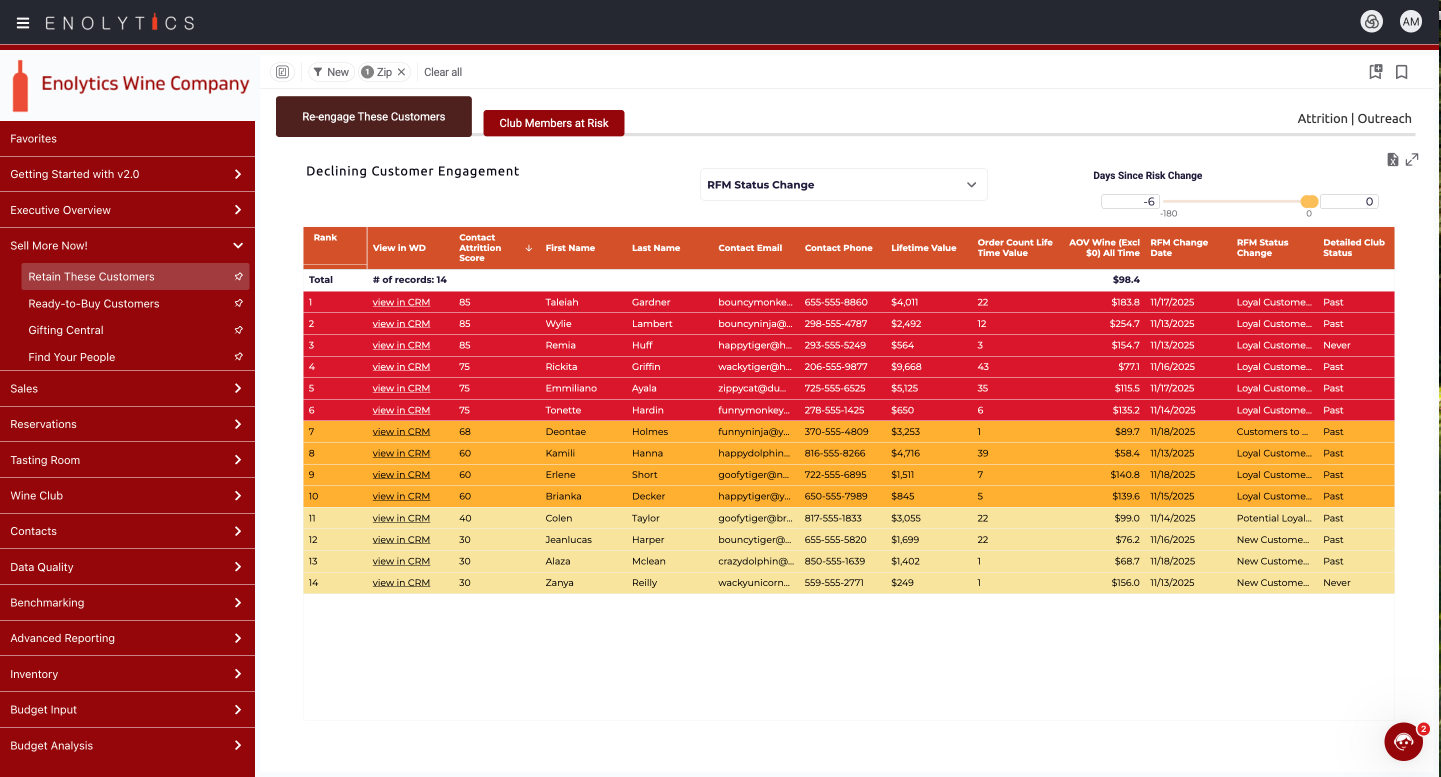
Sell More Now!
The Sell More Now! Module was designed to make it as easy as possible for you to do exactly that—sell more wine, now. It will:
- Easily identify customers and club members in need of a hospitality touch to prevent loss of interest and customer attrition.
- Create highly segmented lists of customers who are ready to buy from you based on our proprietary RFM (recency, frequency, monetary) predictive analytics.
- Identify past gifters, corporate gifters, personal gifters, and potential gifters based on past behavior and predictive analytics.
- Help you plan events on the road or connect directly with customers in a specific area by using our zip code targeter to “find your people.”
-
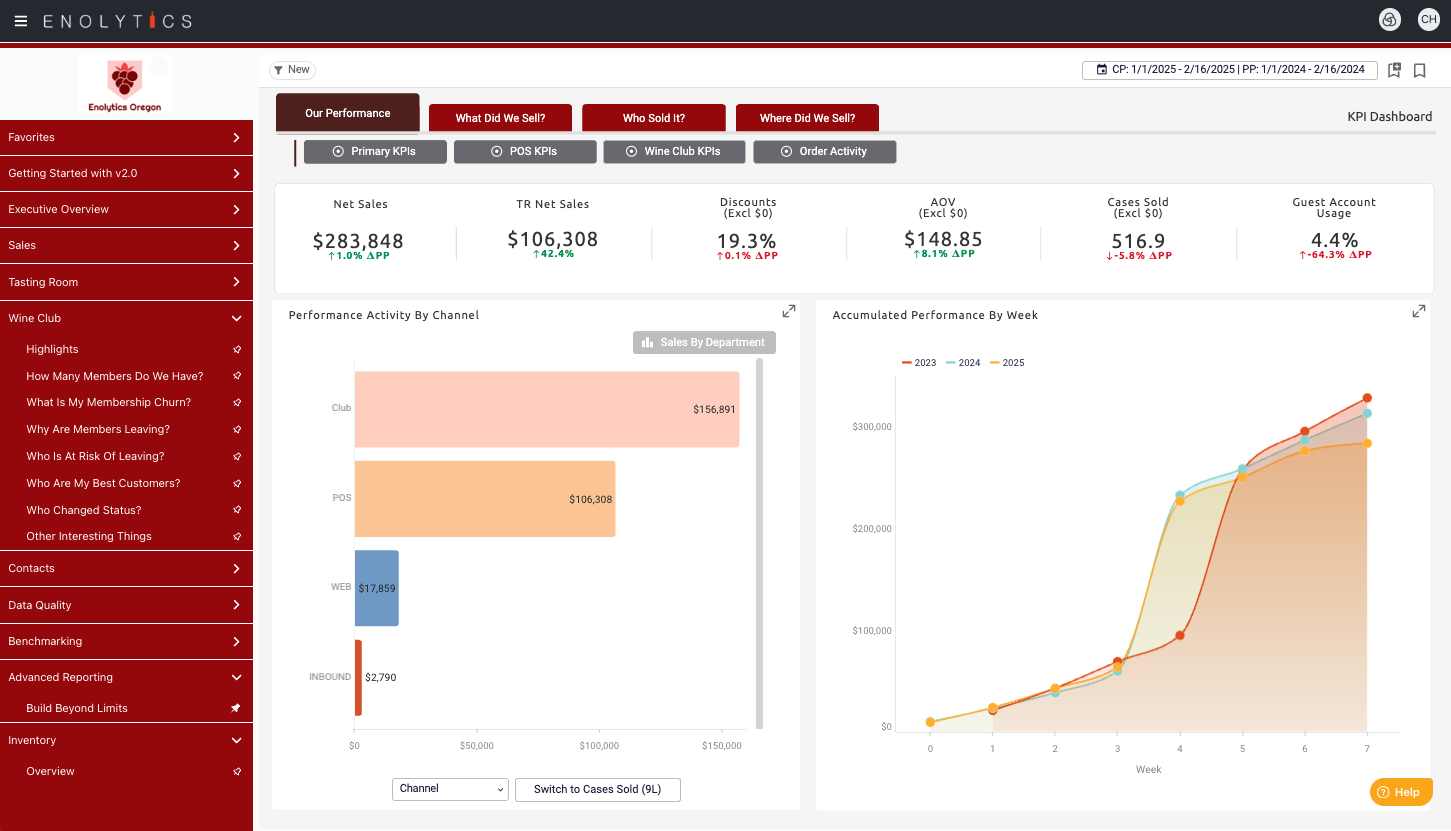
Sales
Easy-to-understand questions helps you see (literally!) the Who, What, Where, When and How-Much of your business
Highlight top-performing varietals and wines by sales and volume
Use basket analysis to identify cross-selling and upselling opportunities
Leverage our enhanced demographics to create hyper-targeted outreach to your customers
Carefully budget and forecast for your business, using our monthly and 12-month rolling views and predictive analytics.
-
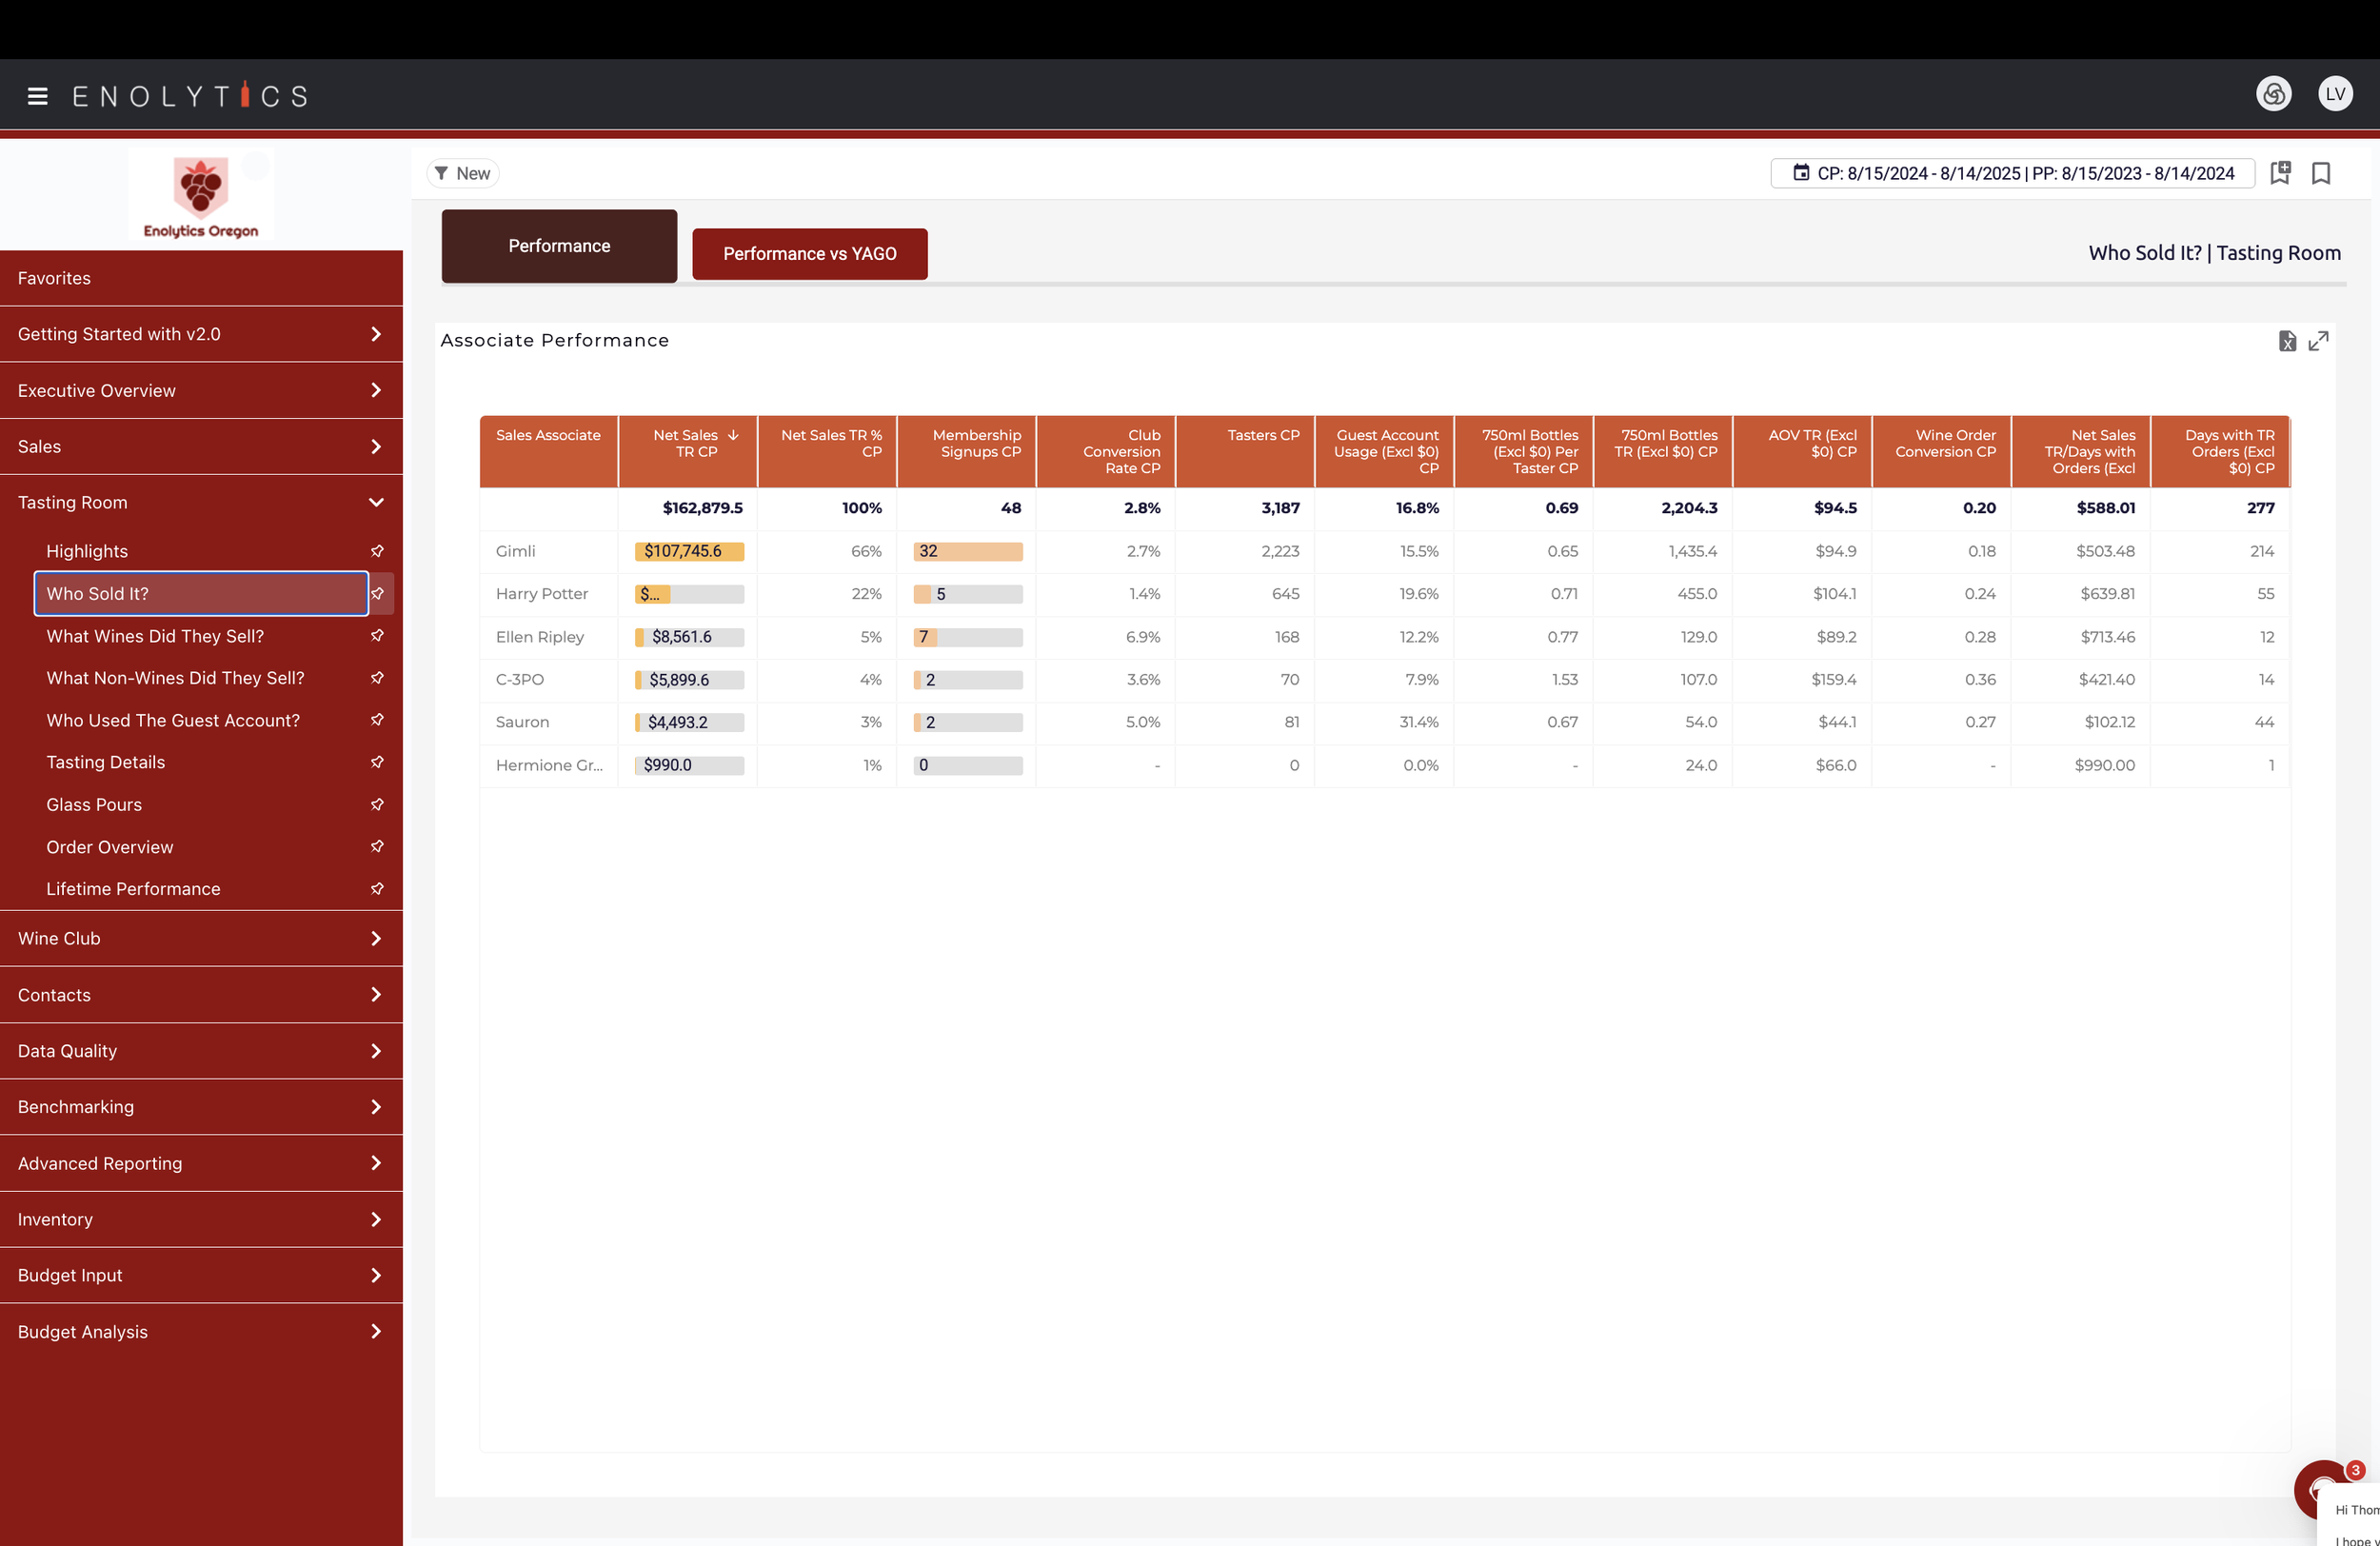
Tasting Room
View tasting room sales associate contribution to performance and variance to goals
Understand what wines and types of wine perform best and sell most seasonally
View monthly and rolling 12-month performance that drives forecasting and budgeting for the tasting room
-
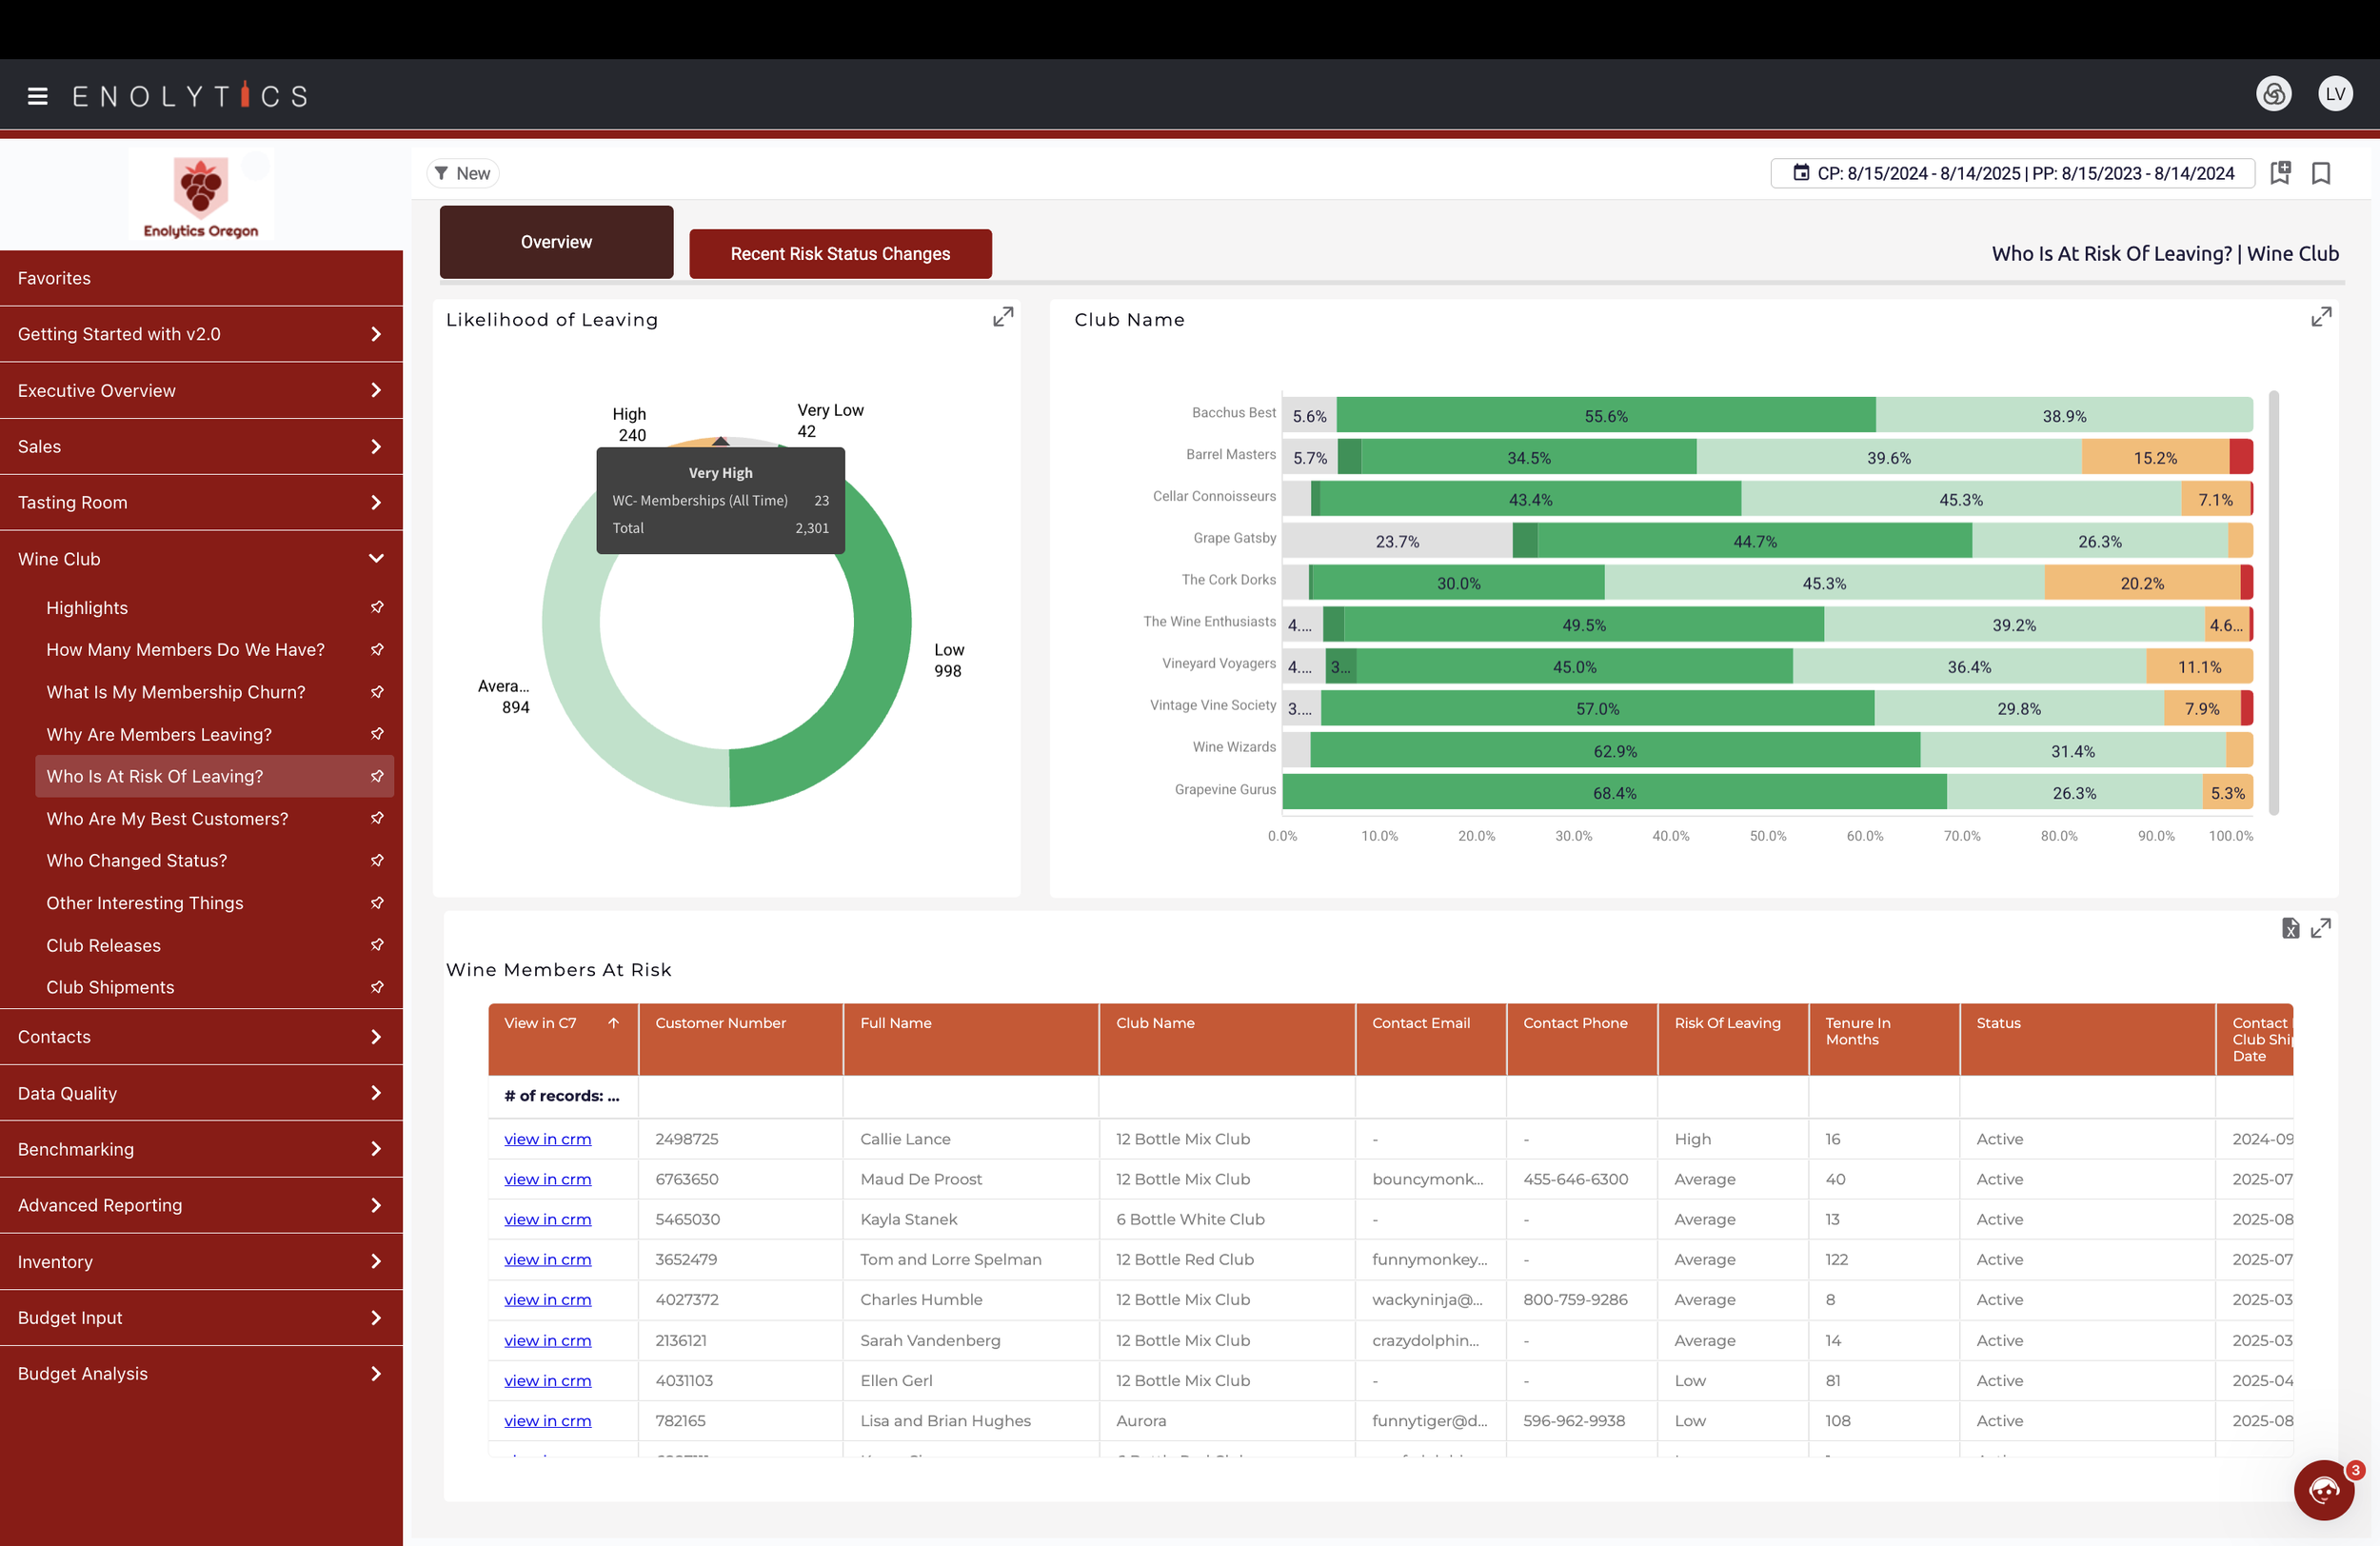
Wine Club
Identify wine club members who are most likely to cancel their membership
Understand churn metrics for each club tier
Identify customers who are perfect prospects to join the wine club
View monthly and rolling 12-month performance that drives forecasting and budgeting for the wine club
-
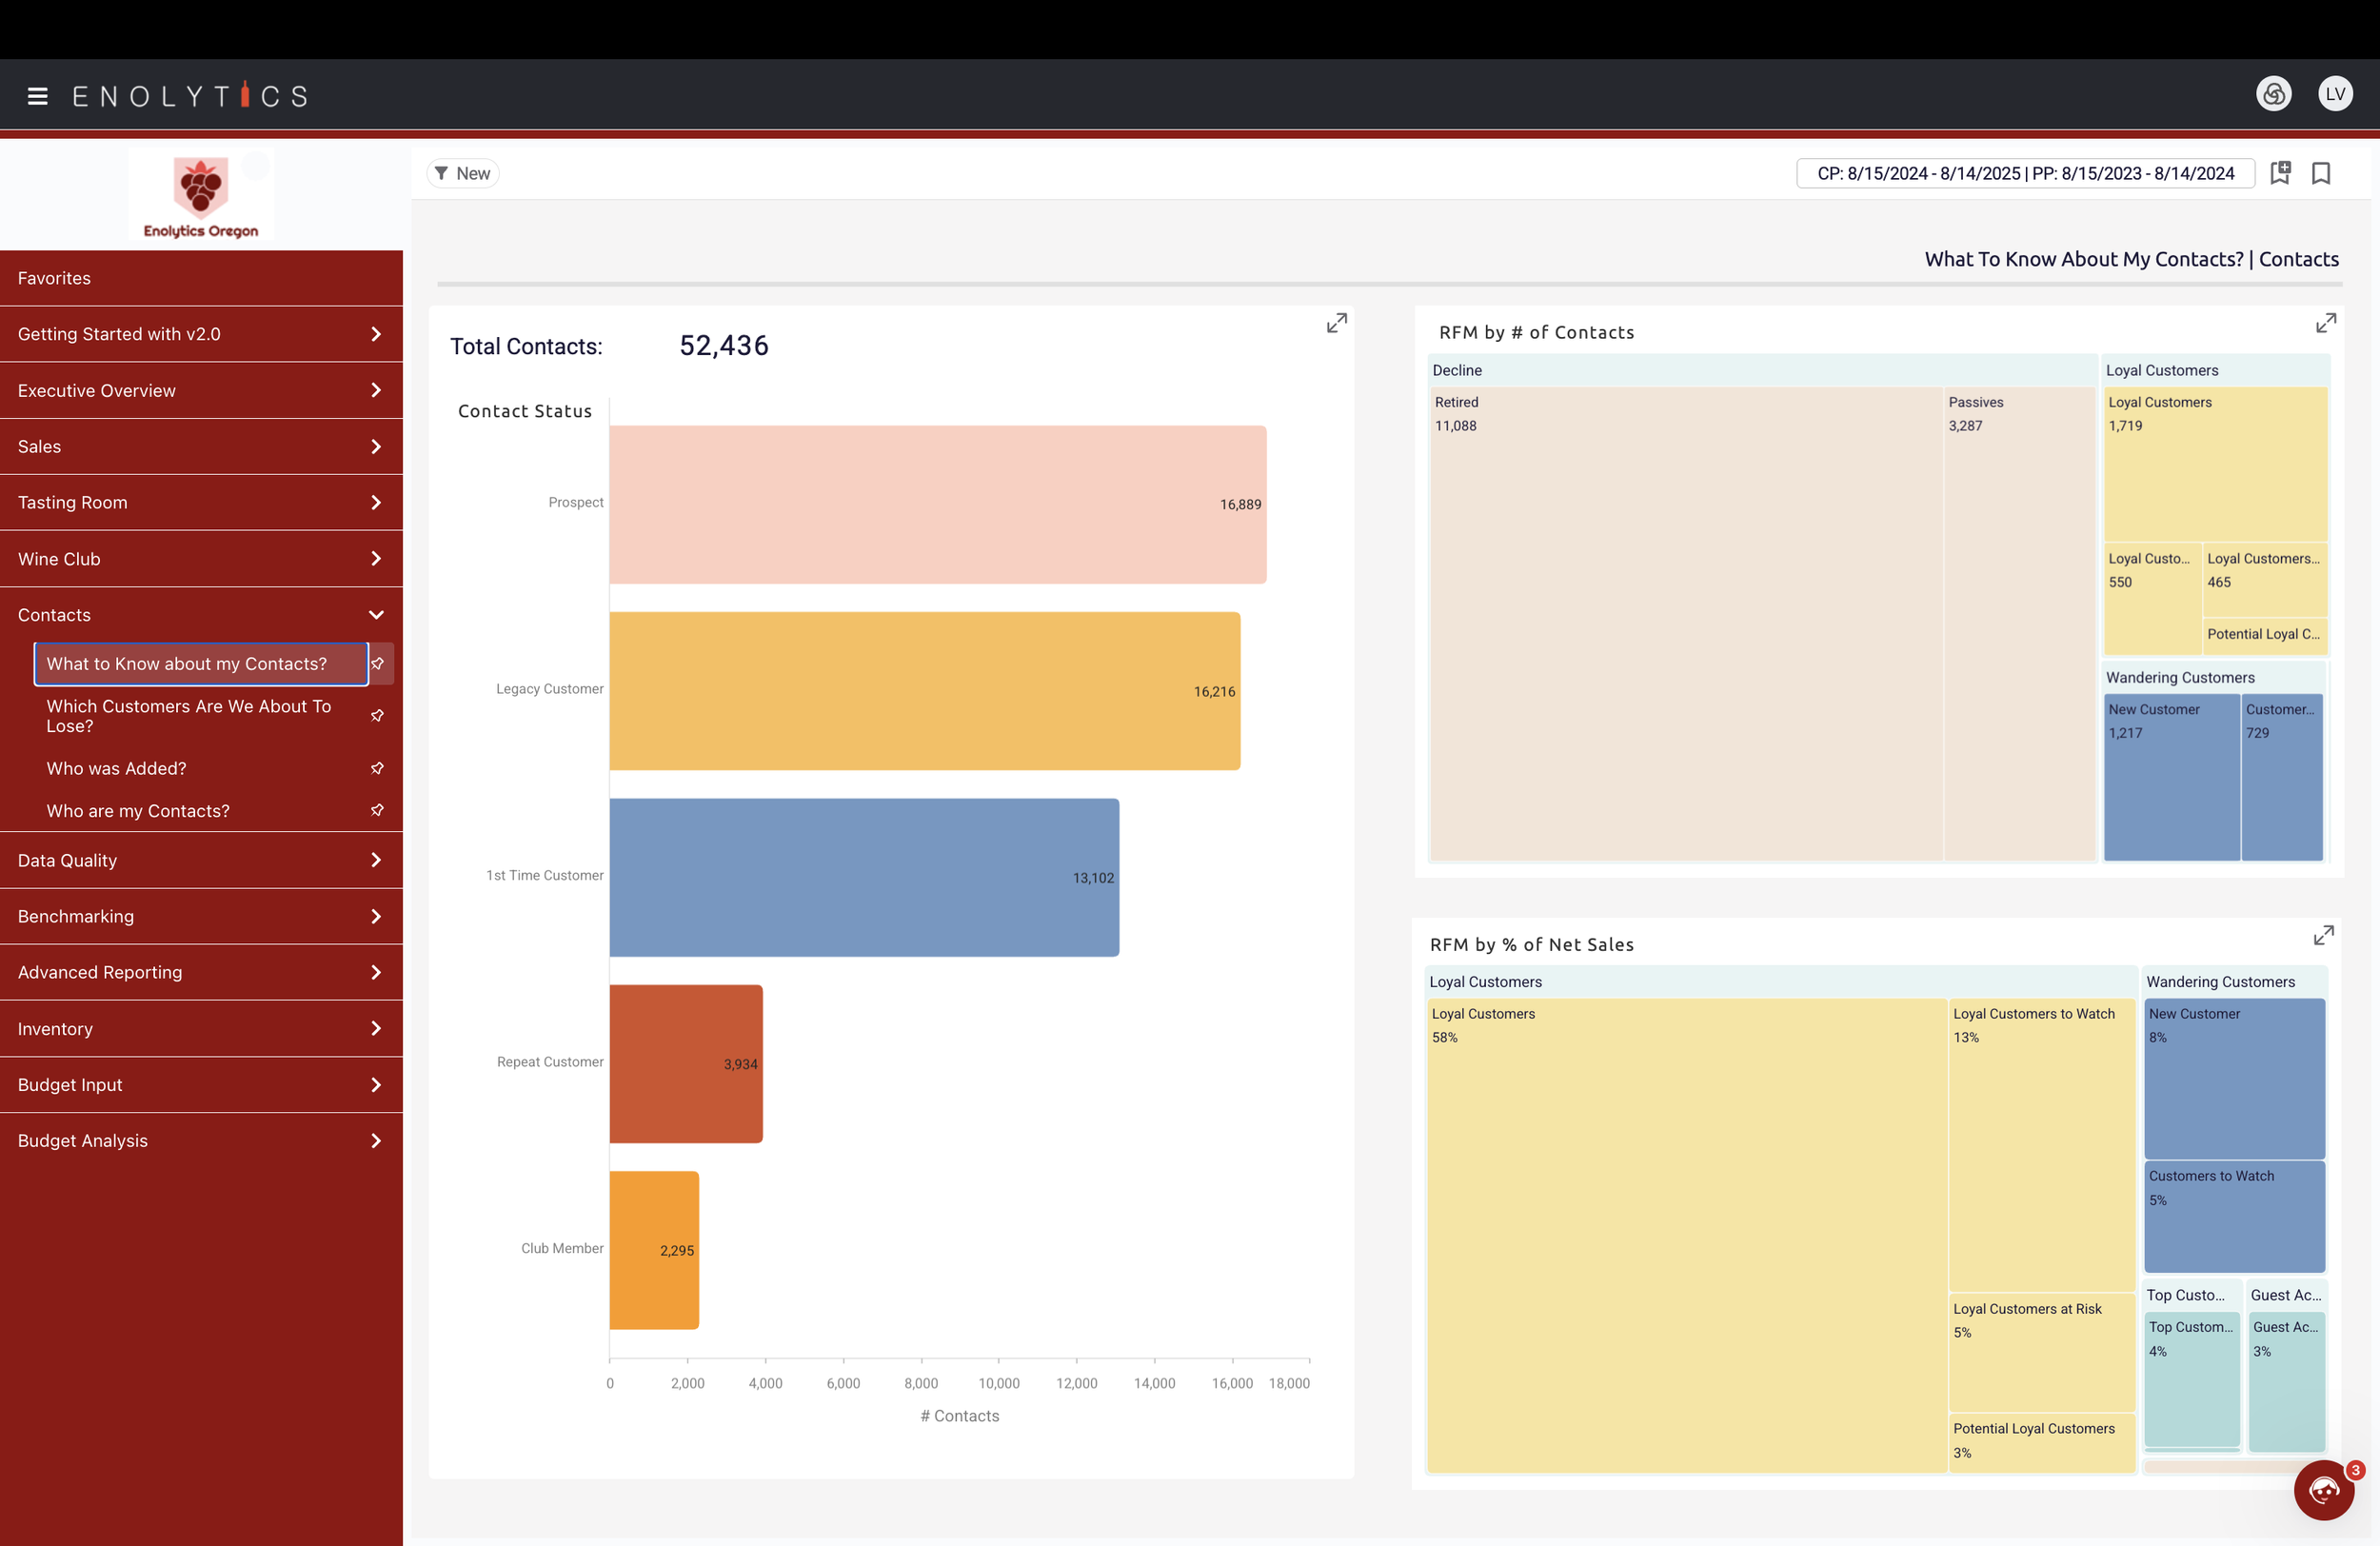
Contacts
Identify where in the sales funnel each customer resides
Automatic customer segmentation by RFM (recency, frequency, monetary) analysis that drive hyper targeted marketing campaigns
Understand Lifetime Value (LTV) of each customer
Identify potential contact duplicates
-
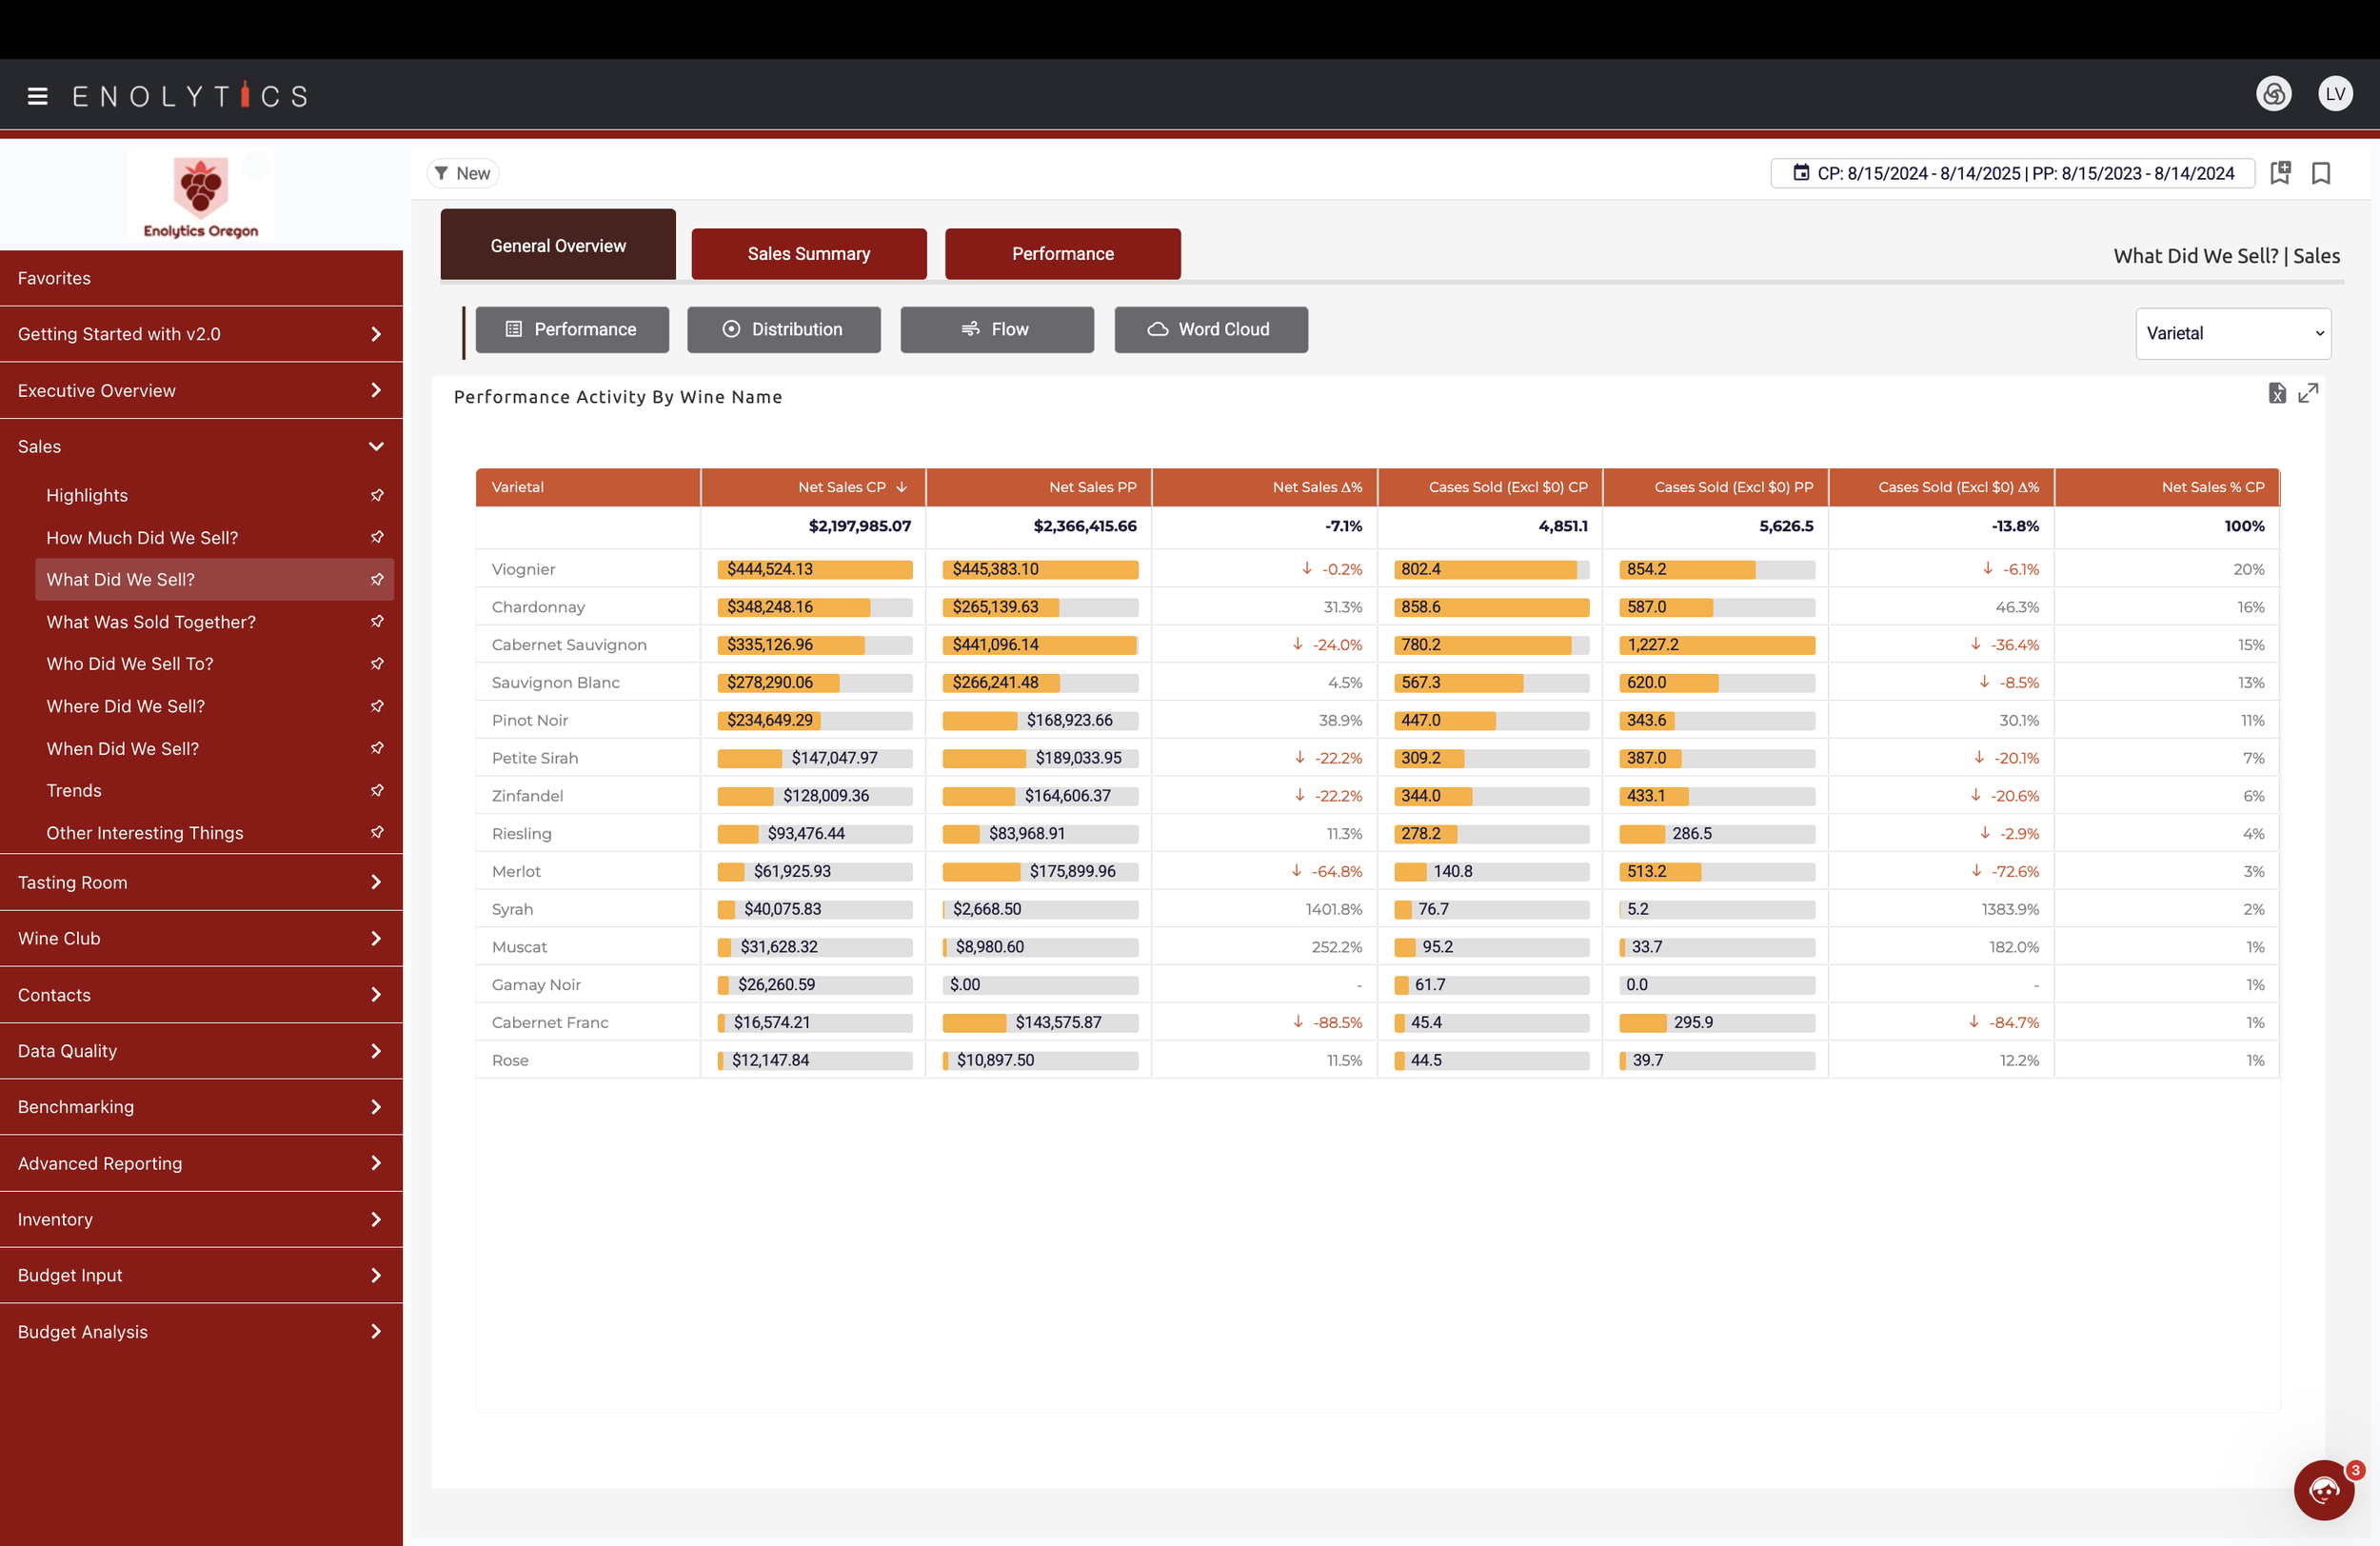
Products
Track performance by Varietal, Wine, Individual SKU, Bundle, and Non-Wine Products
At a glance, understand each product's KPIs such as Net Sales, Lifetime Net Sales, Margins and Discounts

-
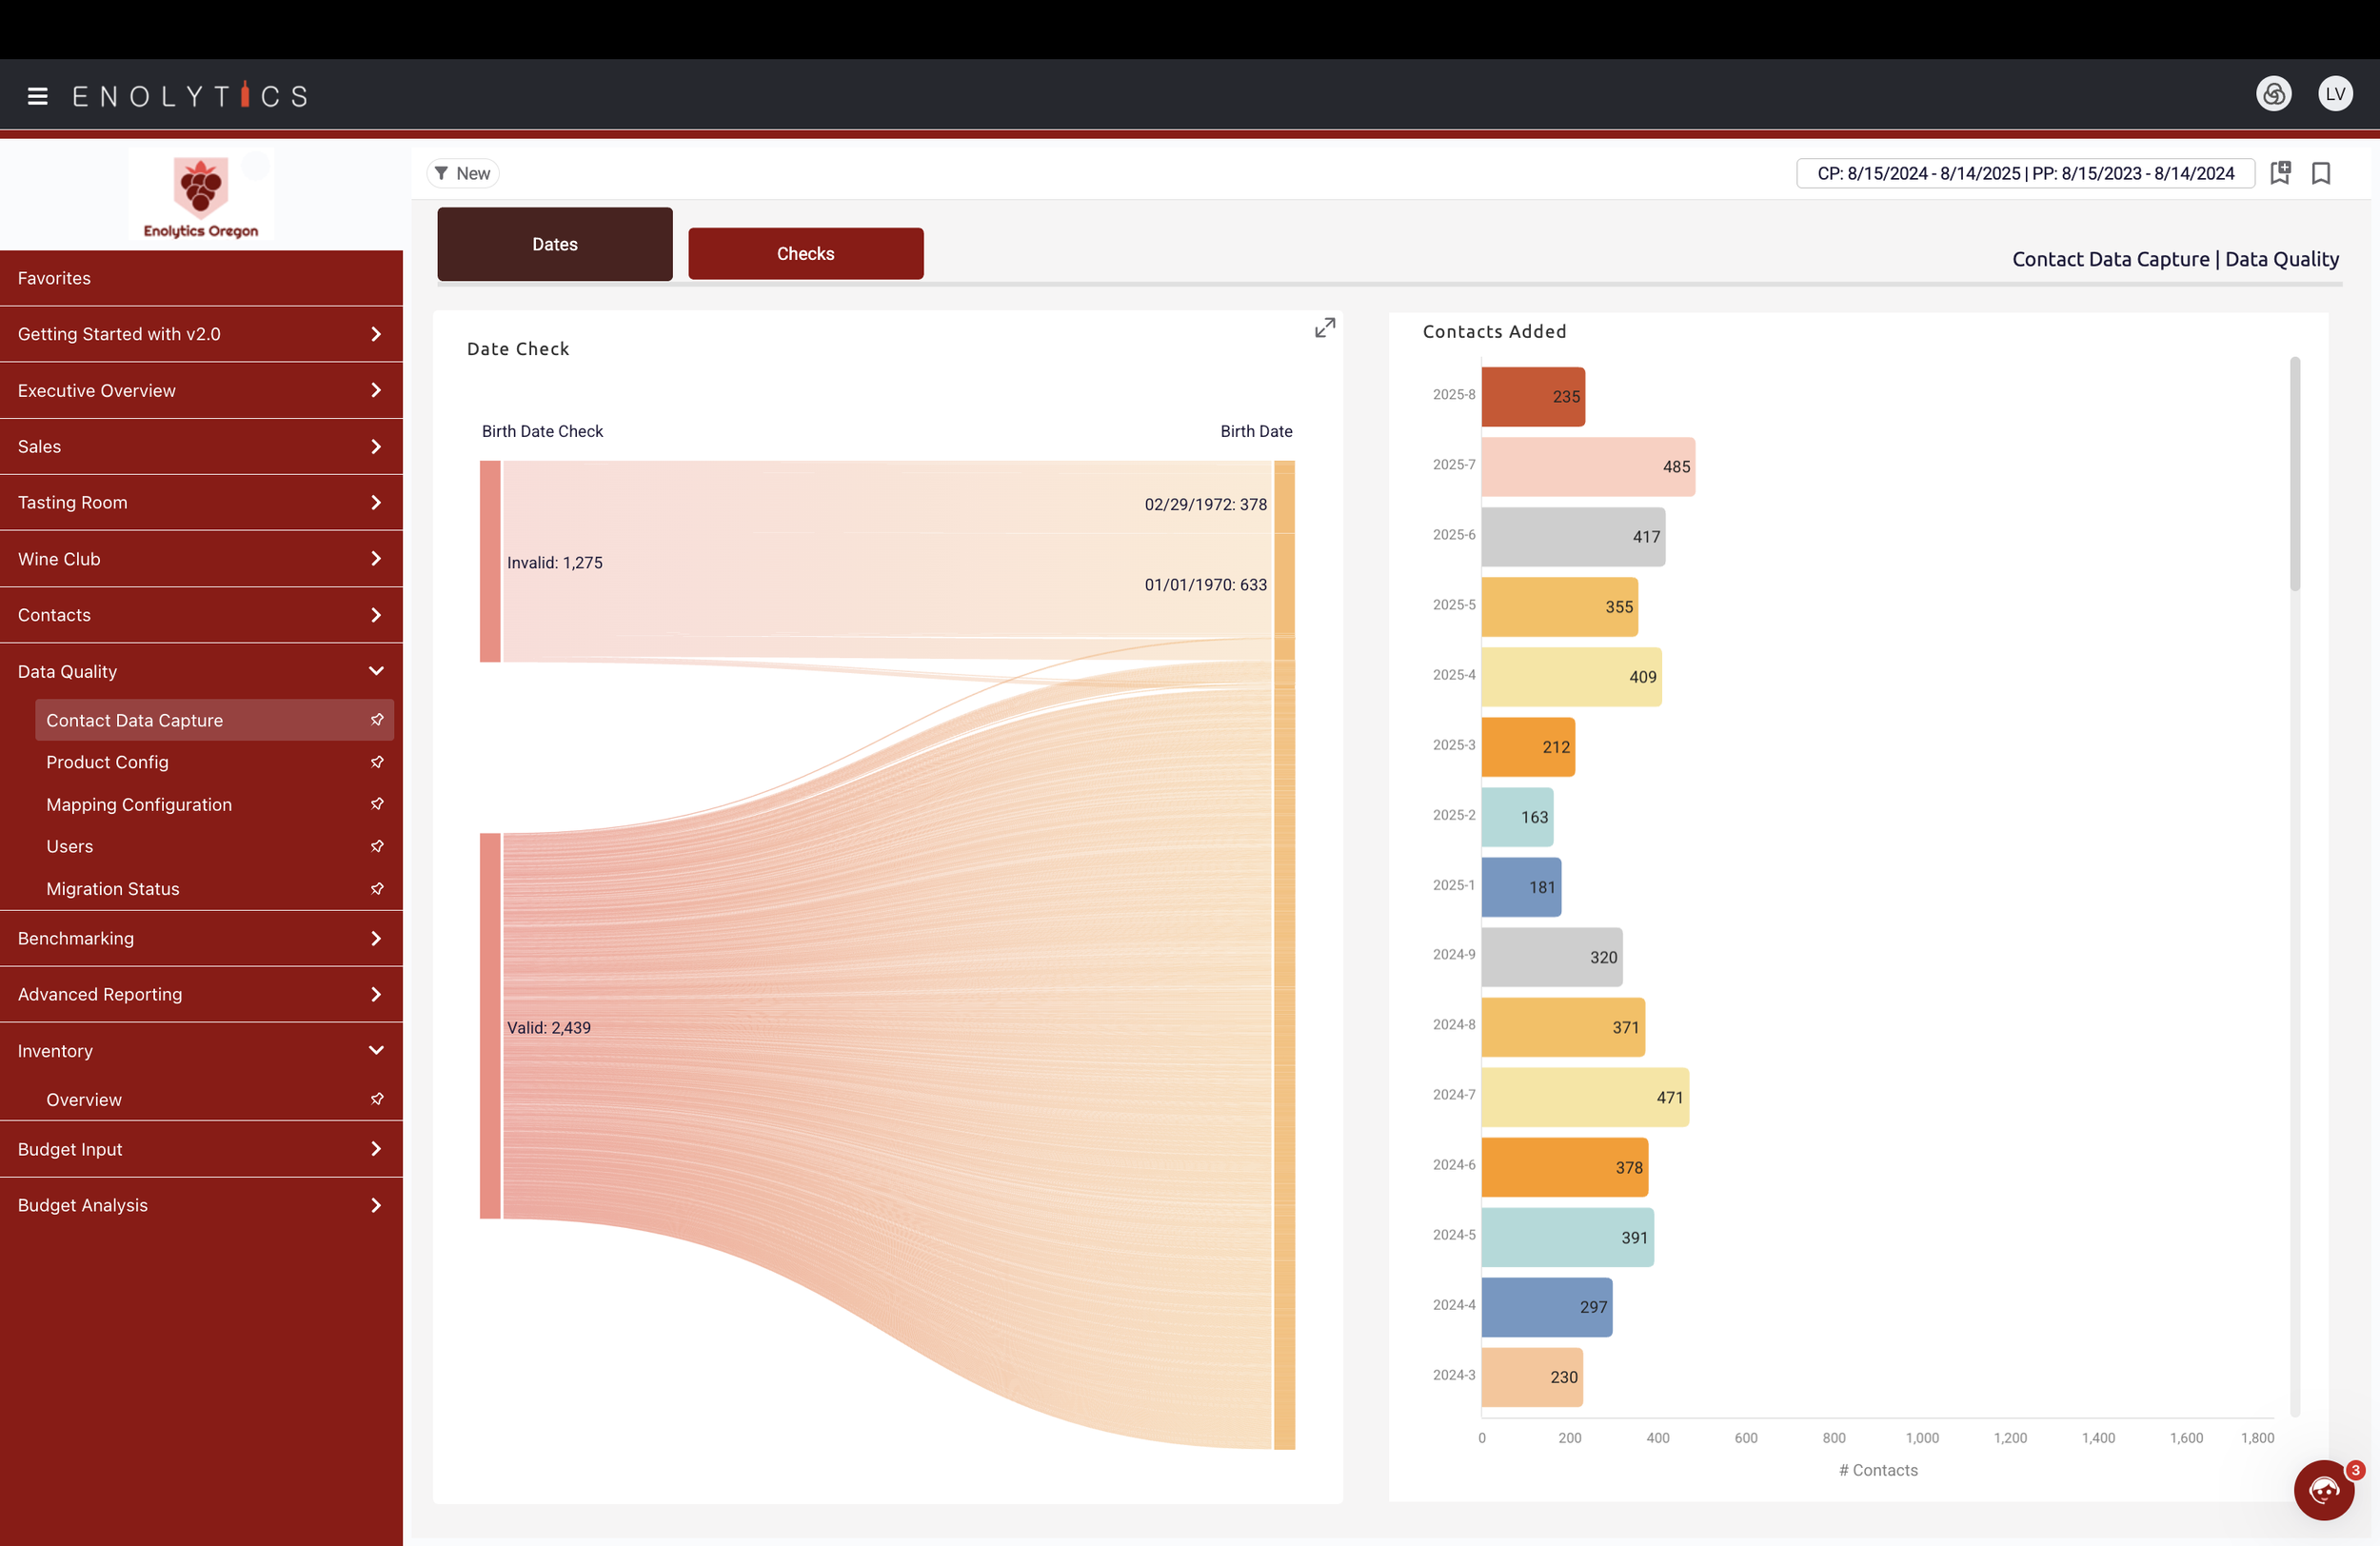
Data Quality
"Good data in, good data out!" Our Data Quality module helps you convert all of your data to "good data."
Identify (so that you can correct) "bad data" within a variety of check points.
For Customer data, check birthdate, name, address, email, phone and possible duplicate records.
For Product data, check variables like Department, Bottle Size and Vintage.
Check for possible duplicate records.
-
Advanced Reporting
The most robust report creation tool in the wine industry that enables you to create any report you need, visualized in a variety of formats, within minutes.
User-generated report interface empowers you to customize the mix of Dimensions and Measures, according to the information you need to know.
Bookmark feature enables you to "Save" a report you'll need again and again. The data will refresh with the most recent data, each time you open the report.
-
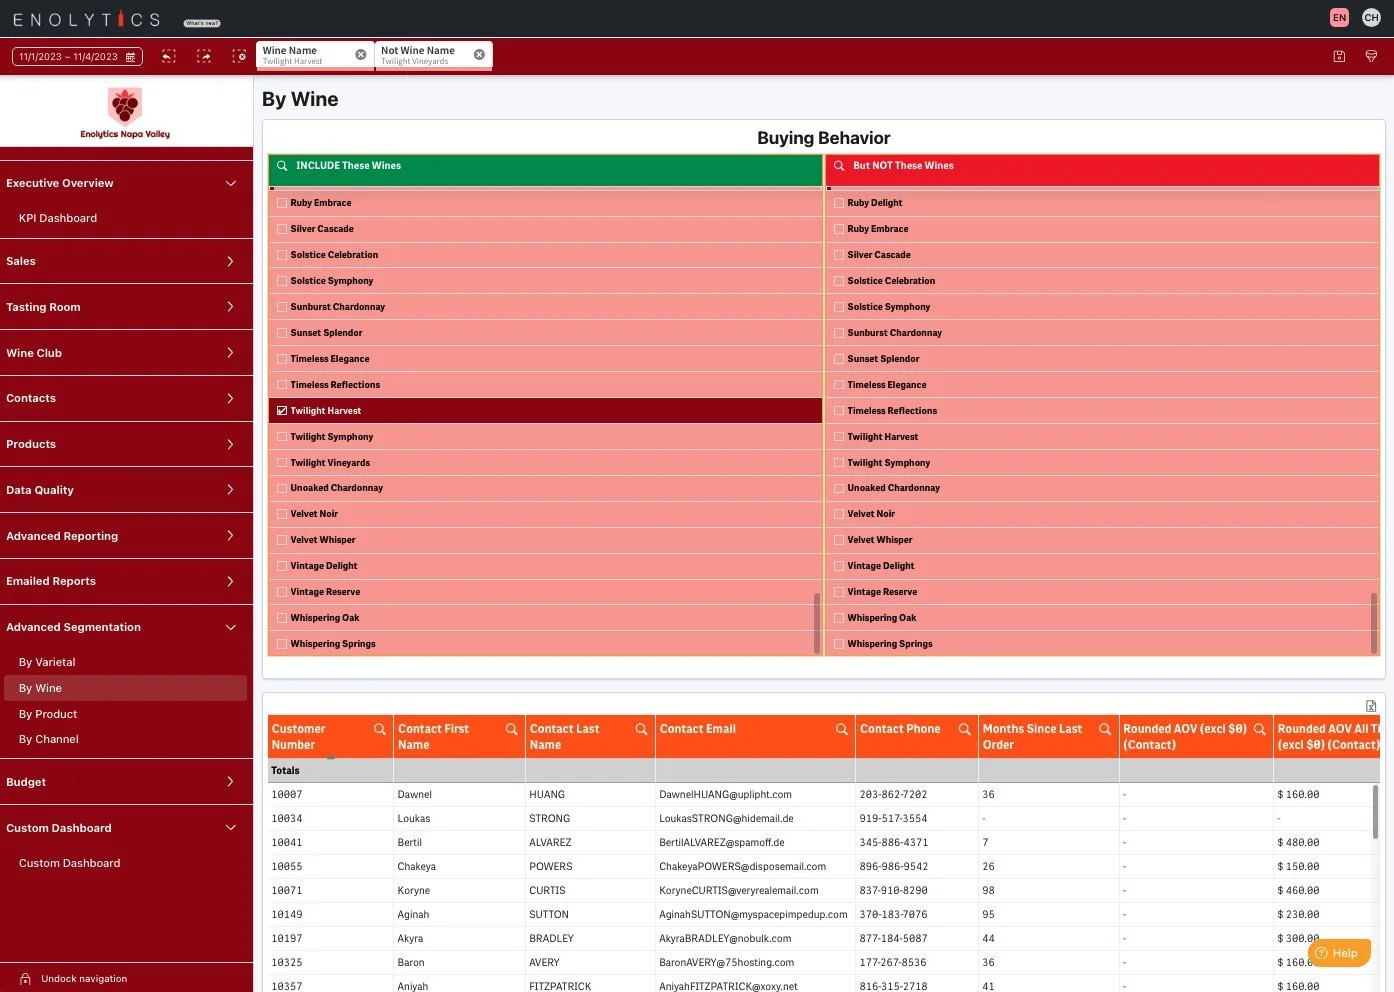
Advanced Segmentation
Identify customers who did one type of behavior but not another. For example, Wine Club customers who never visited your Tasting Room. Or customers who bought one vintage of wine but not the current vintage.
Segment according to Varietal, Wine, Product and Channel.
Easily create "cohorts" of customers who share common behaviors, for more targeted outreach.
-
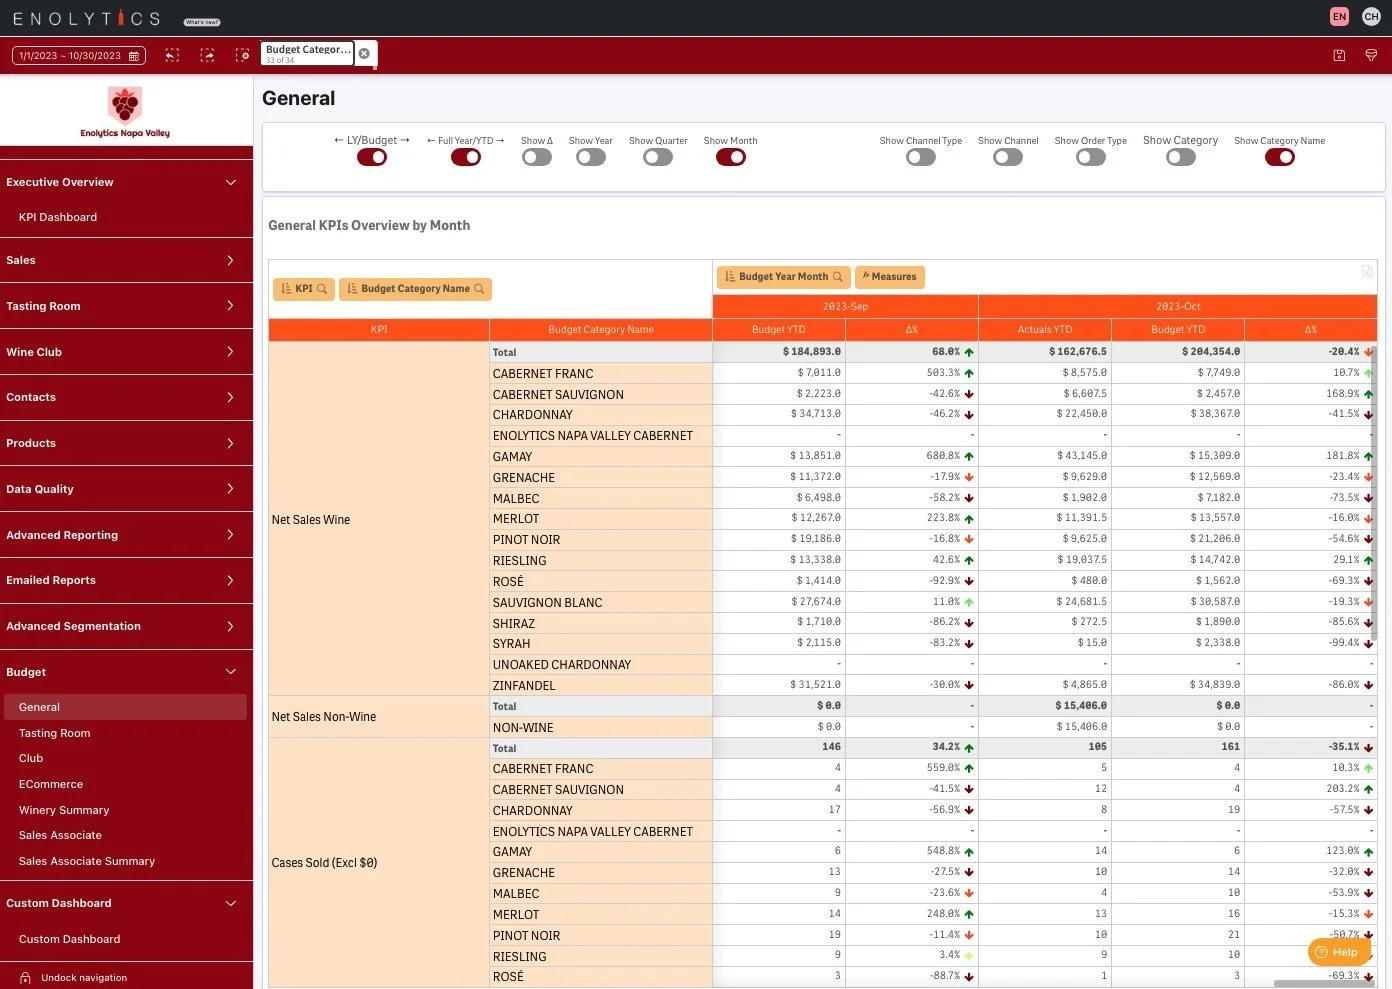
Budget
Budget is the one module that is populated separately from the winery's DTC provider. Enolytics provides the template for the winery to complete.
Track your budget by timeframe (Month, Quarter, Year), Order Type and Category.
Drill down into specific options including Channel (Tasting Room, Club, Ecommerce) and Sales Associate.
-
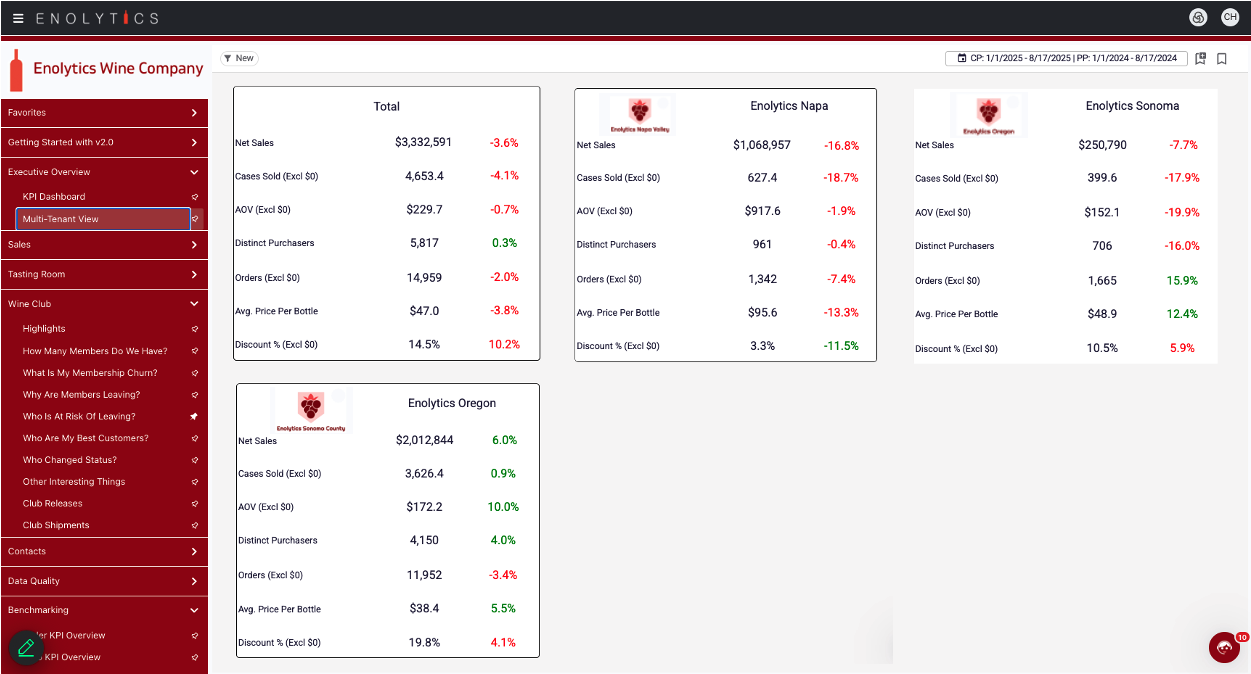
Multi-Tenant
If you are a business group or wine company that owns and manages multiple business units or wine brands, you may be wondering how can you can get a comprehensive view of all your brands individually and organizationally.
Our multi-tenant capabilities remove the heavy lifting of manually retrieving and aggregating data from disparate sources and eliminates significant margins of error, stale data and hours upon hours of effort. Your brands can exist on different wine datasets or tenants (Wine Direct, Commerce7, VinSuite or eCellar), it doesn’t matter.
Take advantage of all the power of our advanced analytics, AI and decision analysis with the ability to view performance and analyze your data at the company level as well as drill-down capabilities to the brand level.es here