
The Costly Mistake Most Wineries Make in Wholesale
Relying on your distributor to sell your wines is no longer enough. With industry consolidation and fierce competition, brands that wait for orders risk losing shelf space—and market share.
Through an industry-leading partnership with VIP, Enolytics gives you a 360 degree power view of your sales data across all distributors, combined with DTC wine and geographic insights, so you can increase sales velocity, retain key accounts, and pinpoint high-value new opportunities. Stop guessing and get clarity on which accounts and chains to target, thus empowering your distributors with the industry intelligence they need to sell your wines.
Explore Enolytics for Depletion
Modules
-
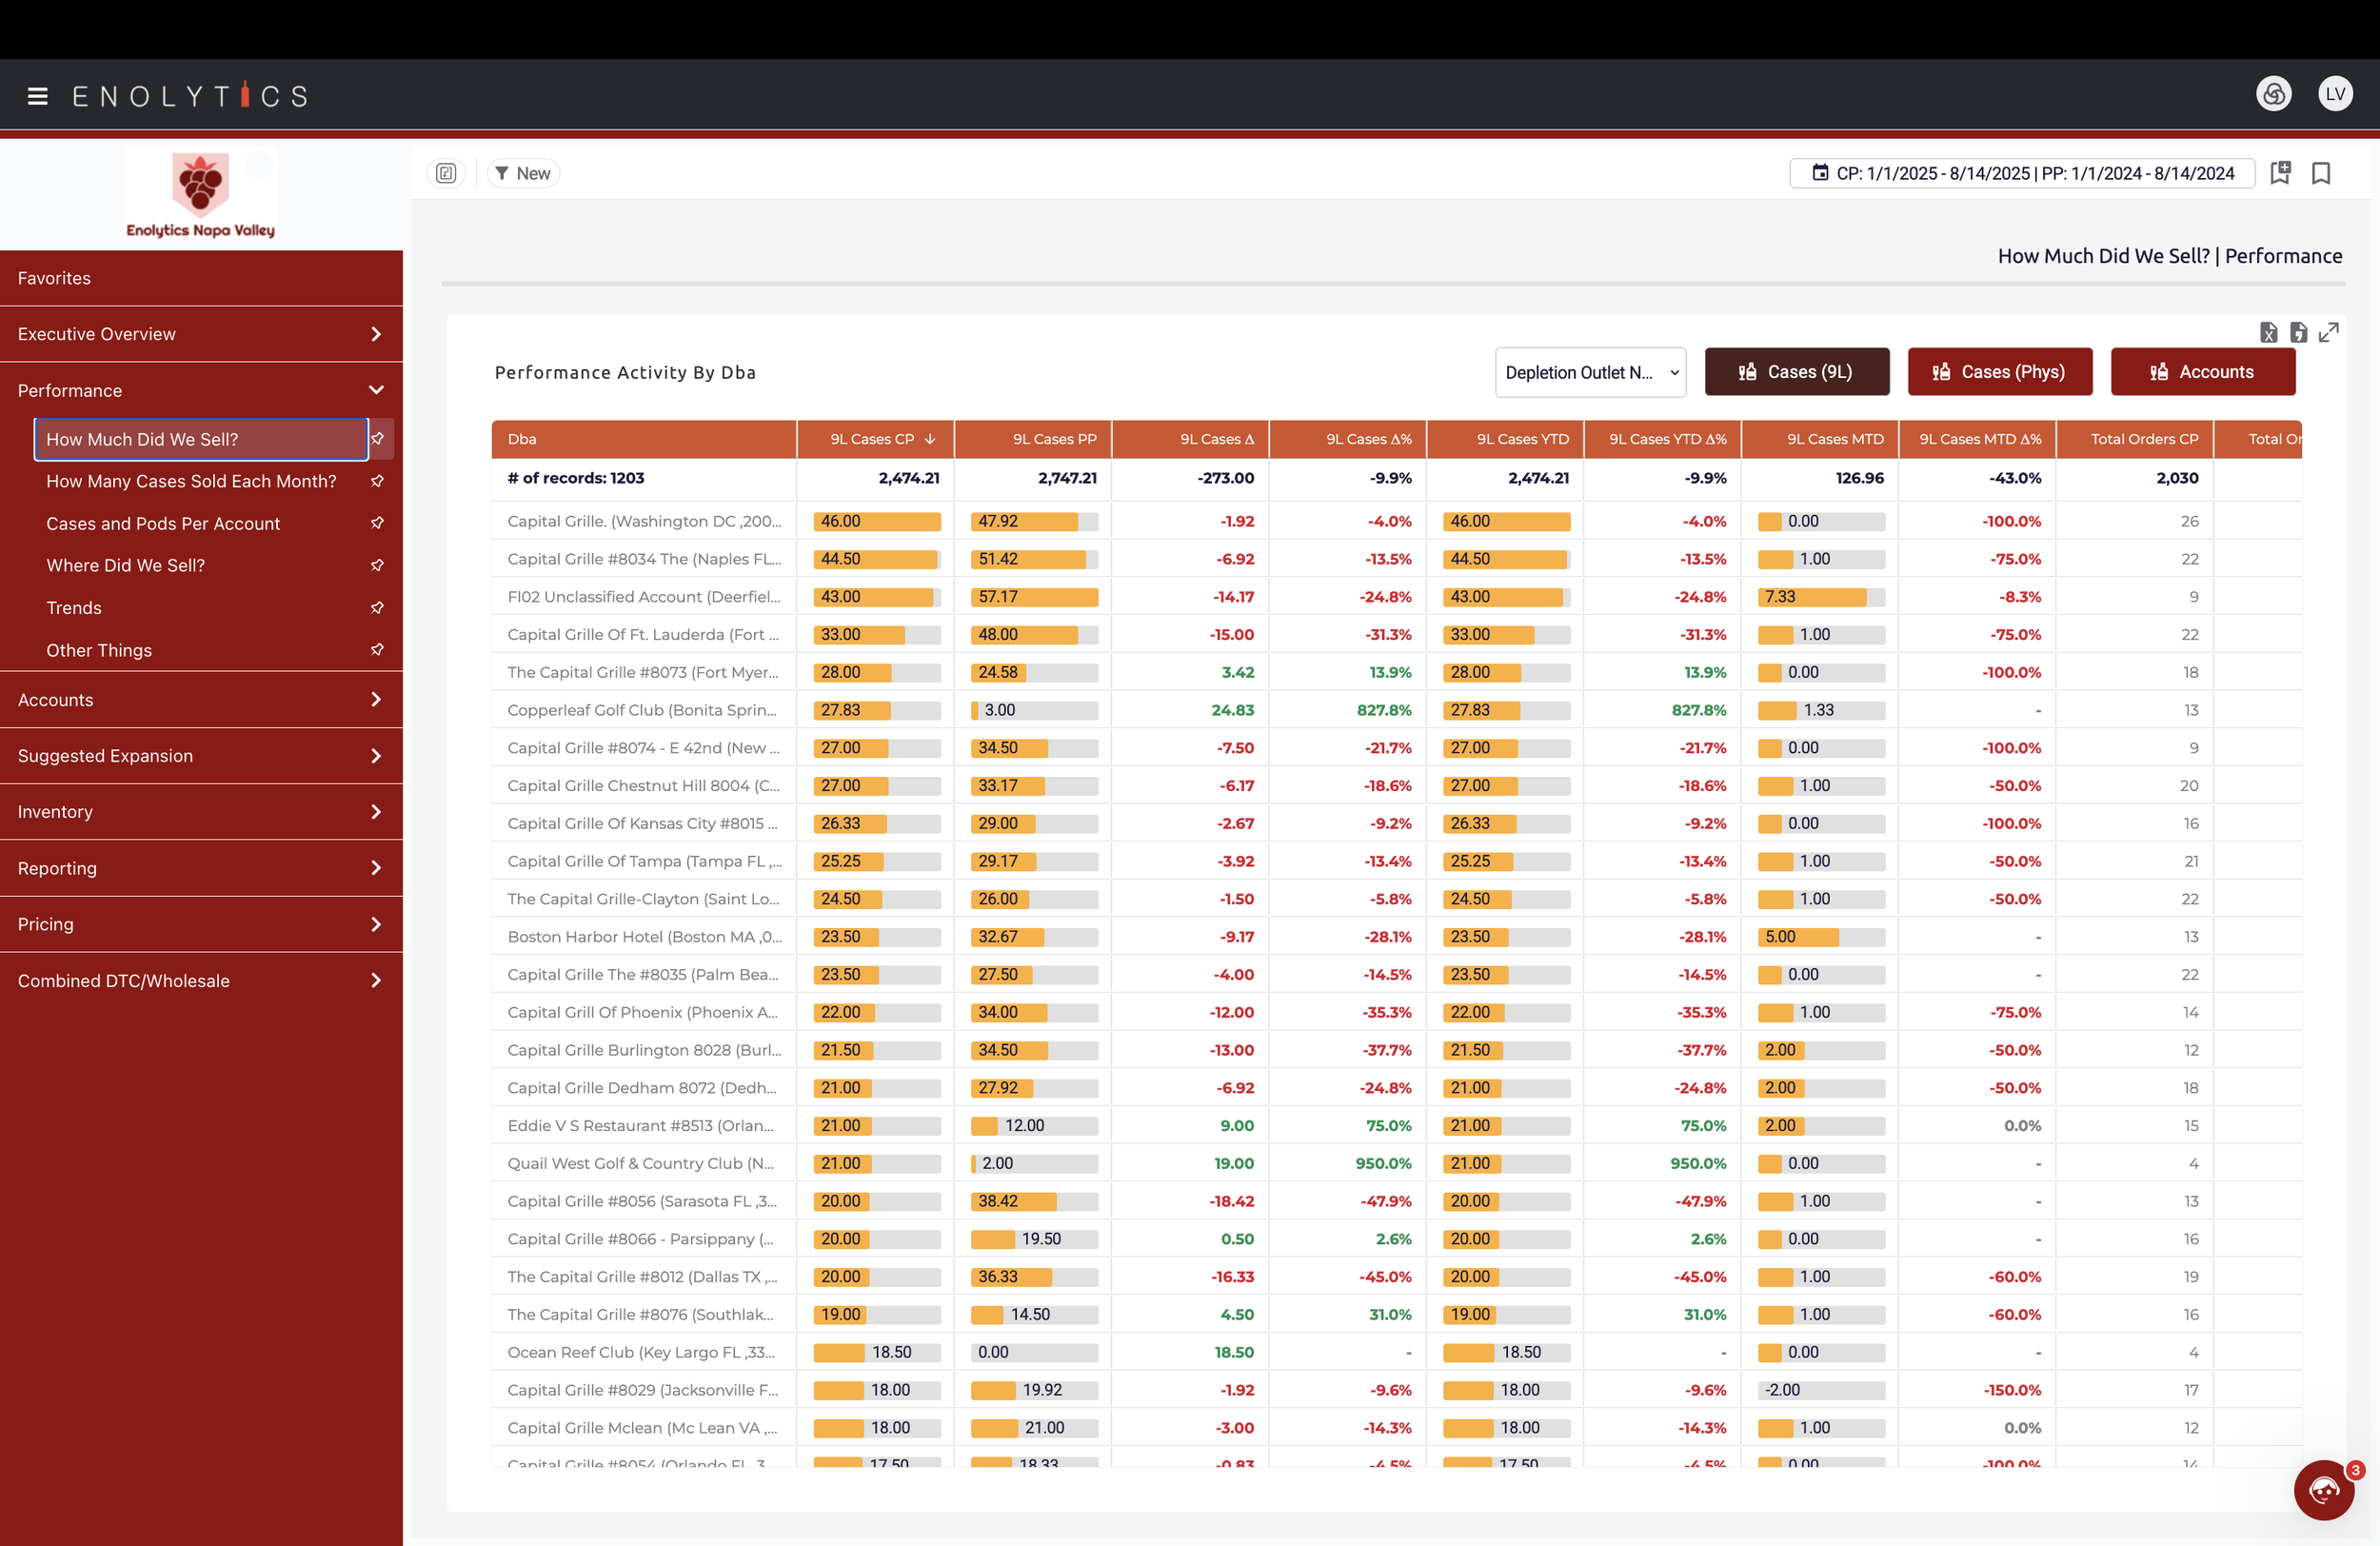
Performance
Turn Wholesale Data Into Performance Gains: Get instant answers to the who, what, where, when, and how much of your wholesale wine business — in a clean, visual format that makes action obvious.
Spot top performers fast: Identify your highest-revenue accounts, distributors, and markets by both sales and volume.
See the full picture: Map accounts geographically and overlay DTC wine data for deeper insight into buying patterns.
Plan with precision: Use monthly and 12-month rolling views with predictive analytics to budget confidently and forecast growth.
-
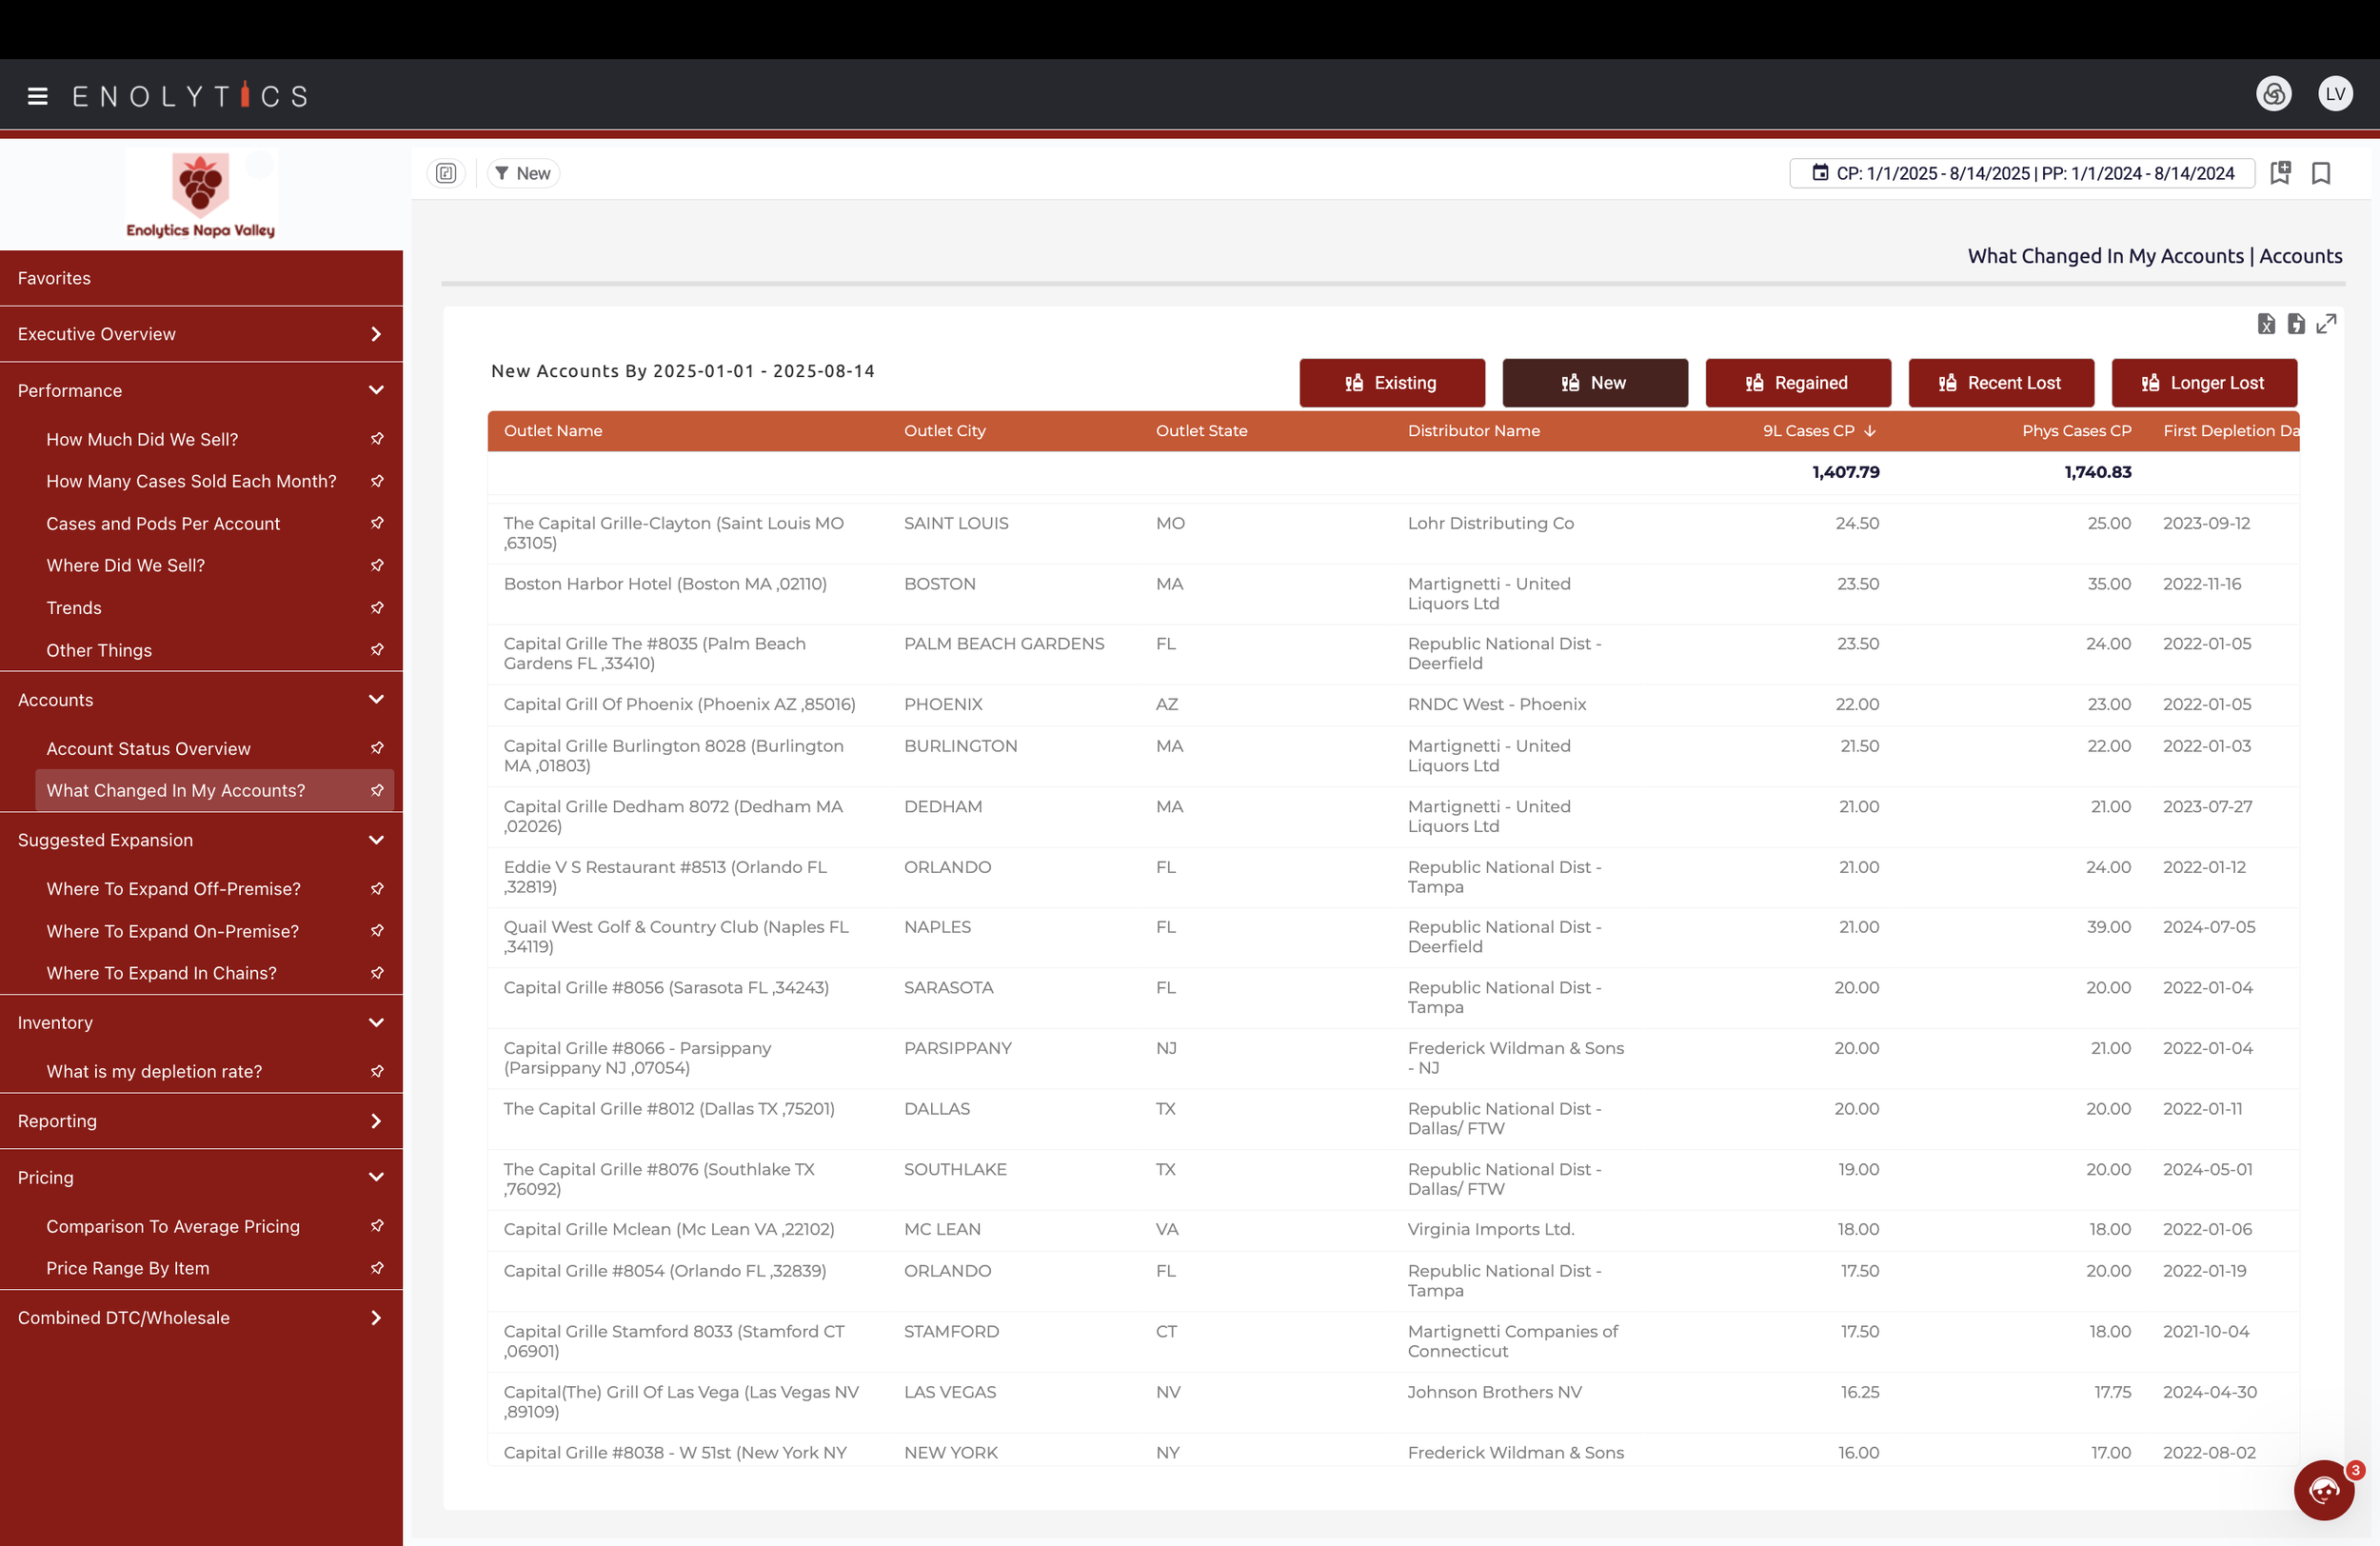
Accounts
Track account status by month within distributor, market, type, sales person and state
Identify what has changed in your accounts including new, regained, and lost accounts
-
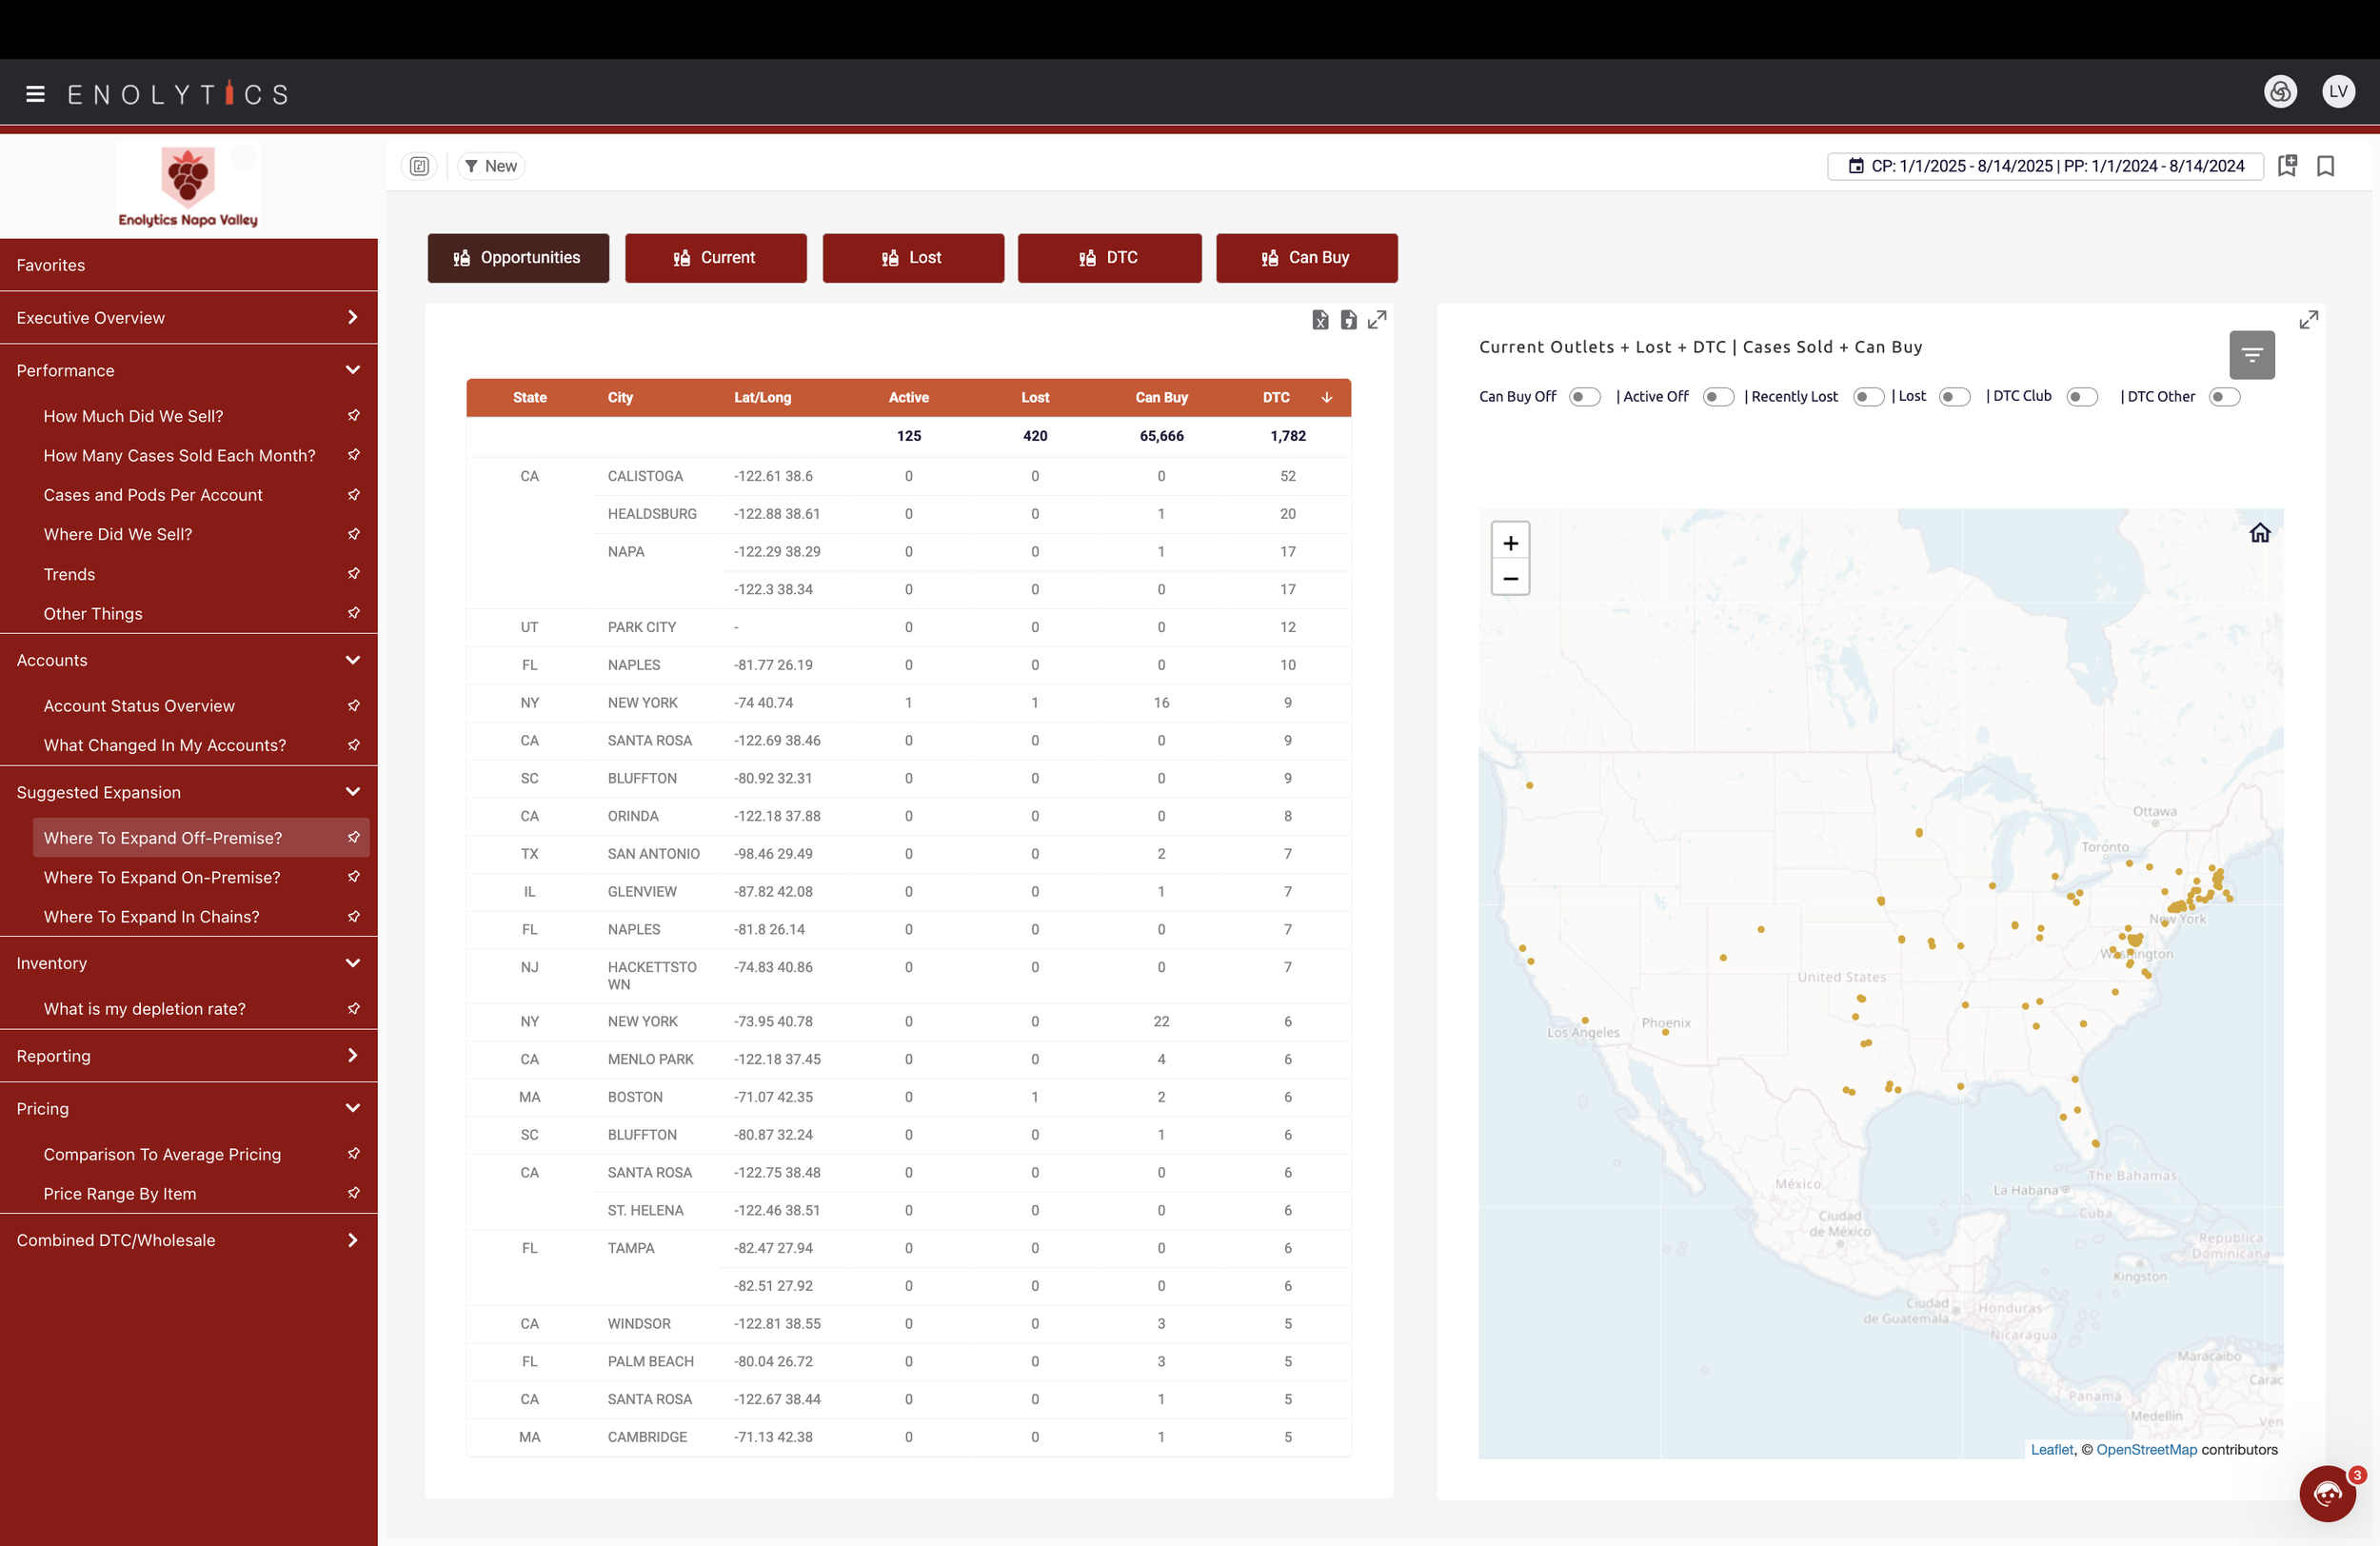
Suggested Expansions
Identify opportunities to expand your on/off premise business as well as chains
Utilize advanced geographical mapping, VIP attributes as well as Google Profile attributes to identify “can buy” accounts down to a single square mile area in the country
Overlay DTC data to understand existing advocates and buyers in the target areas
-
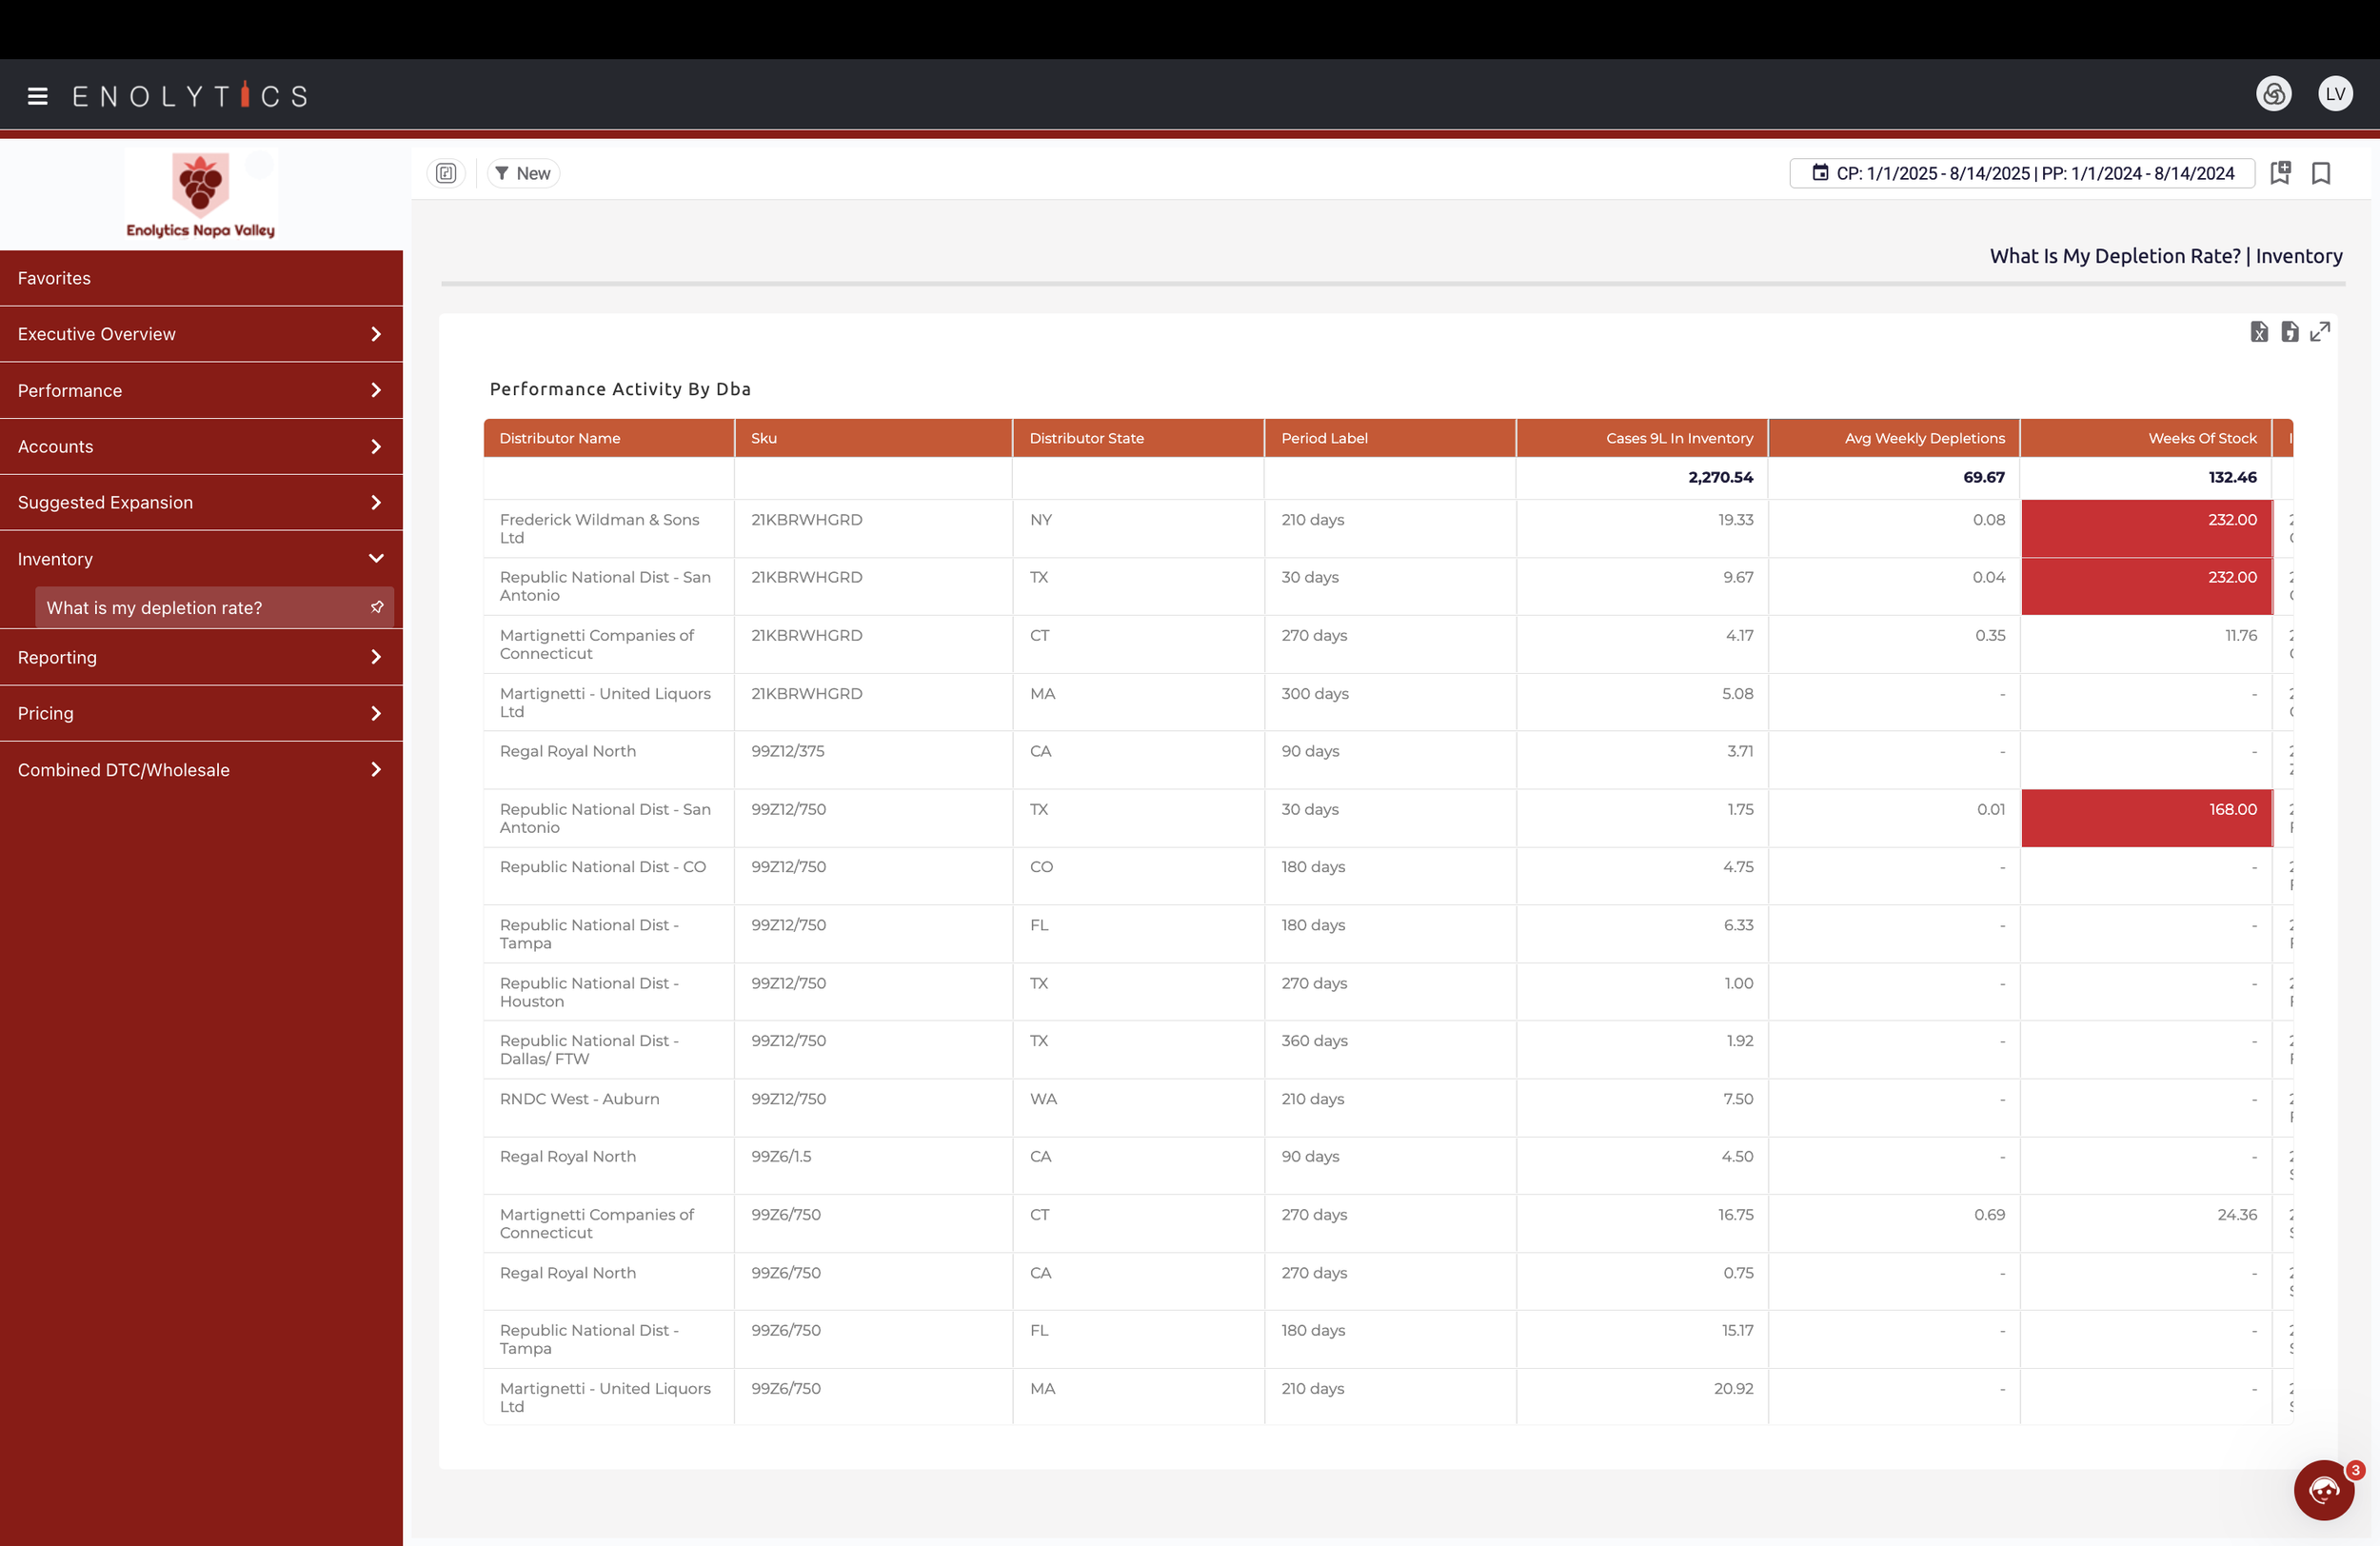
Inventory
Understand days inventory on hand, depletion rate, weeks of stock by distributor, SKU and time period
View your monthly inventory by wine
Drill-down to inventory levels by SKU, market, distributor and state
-
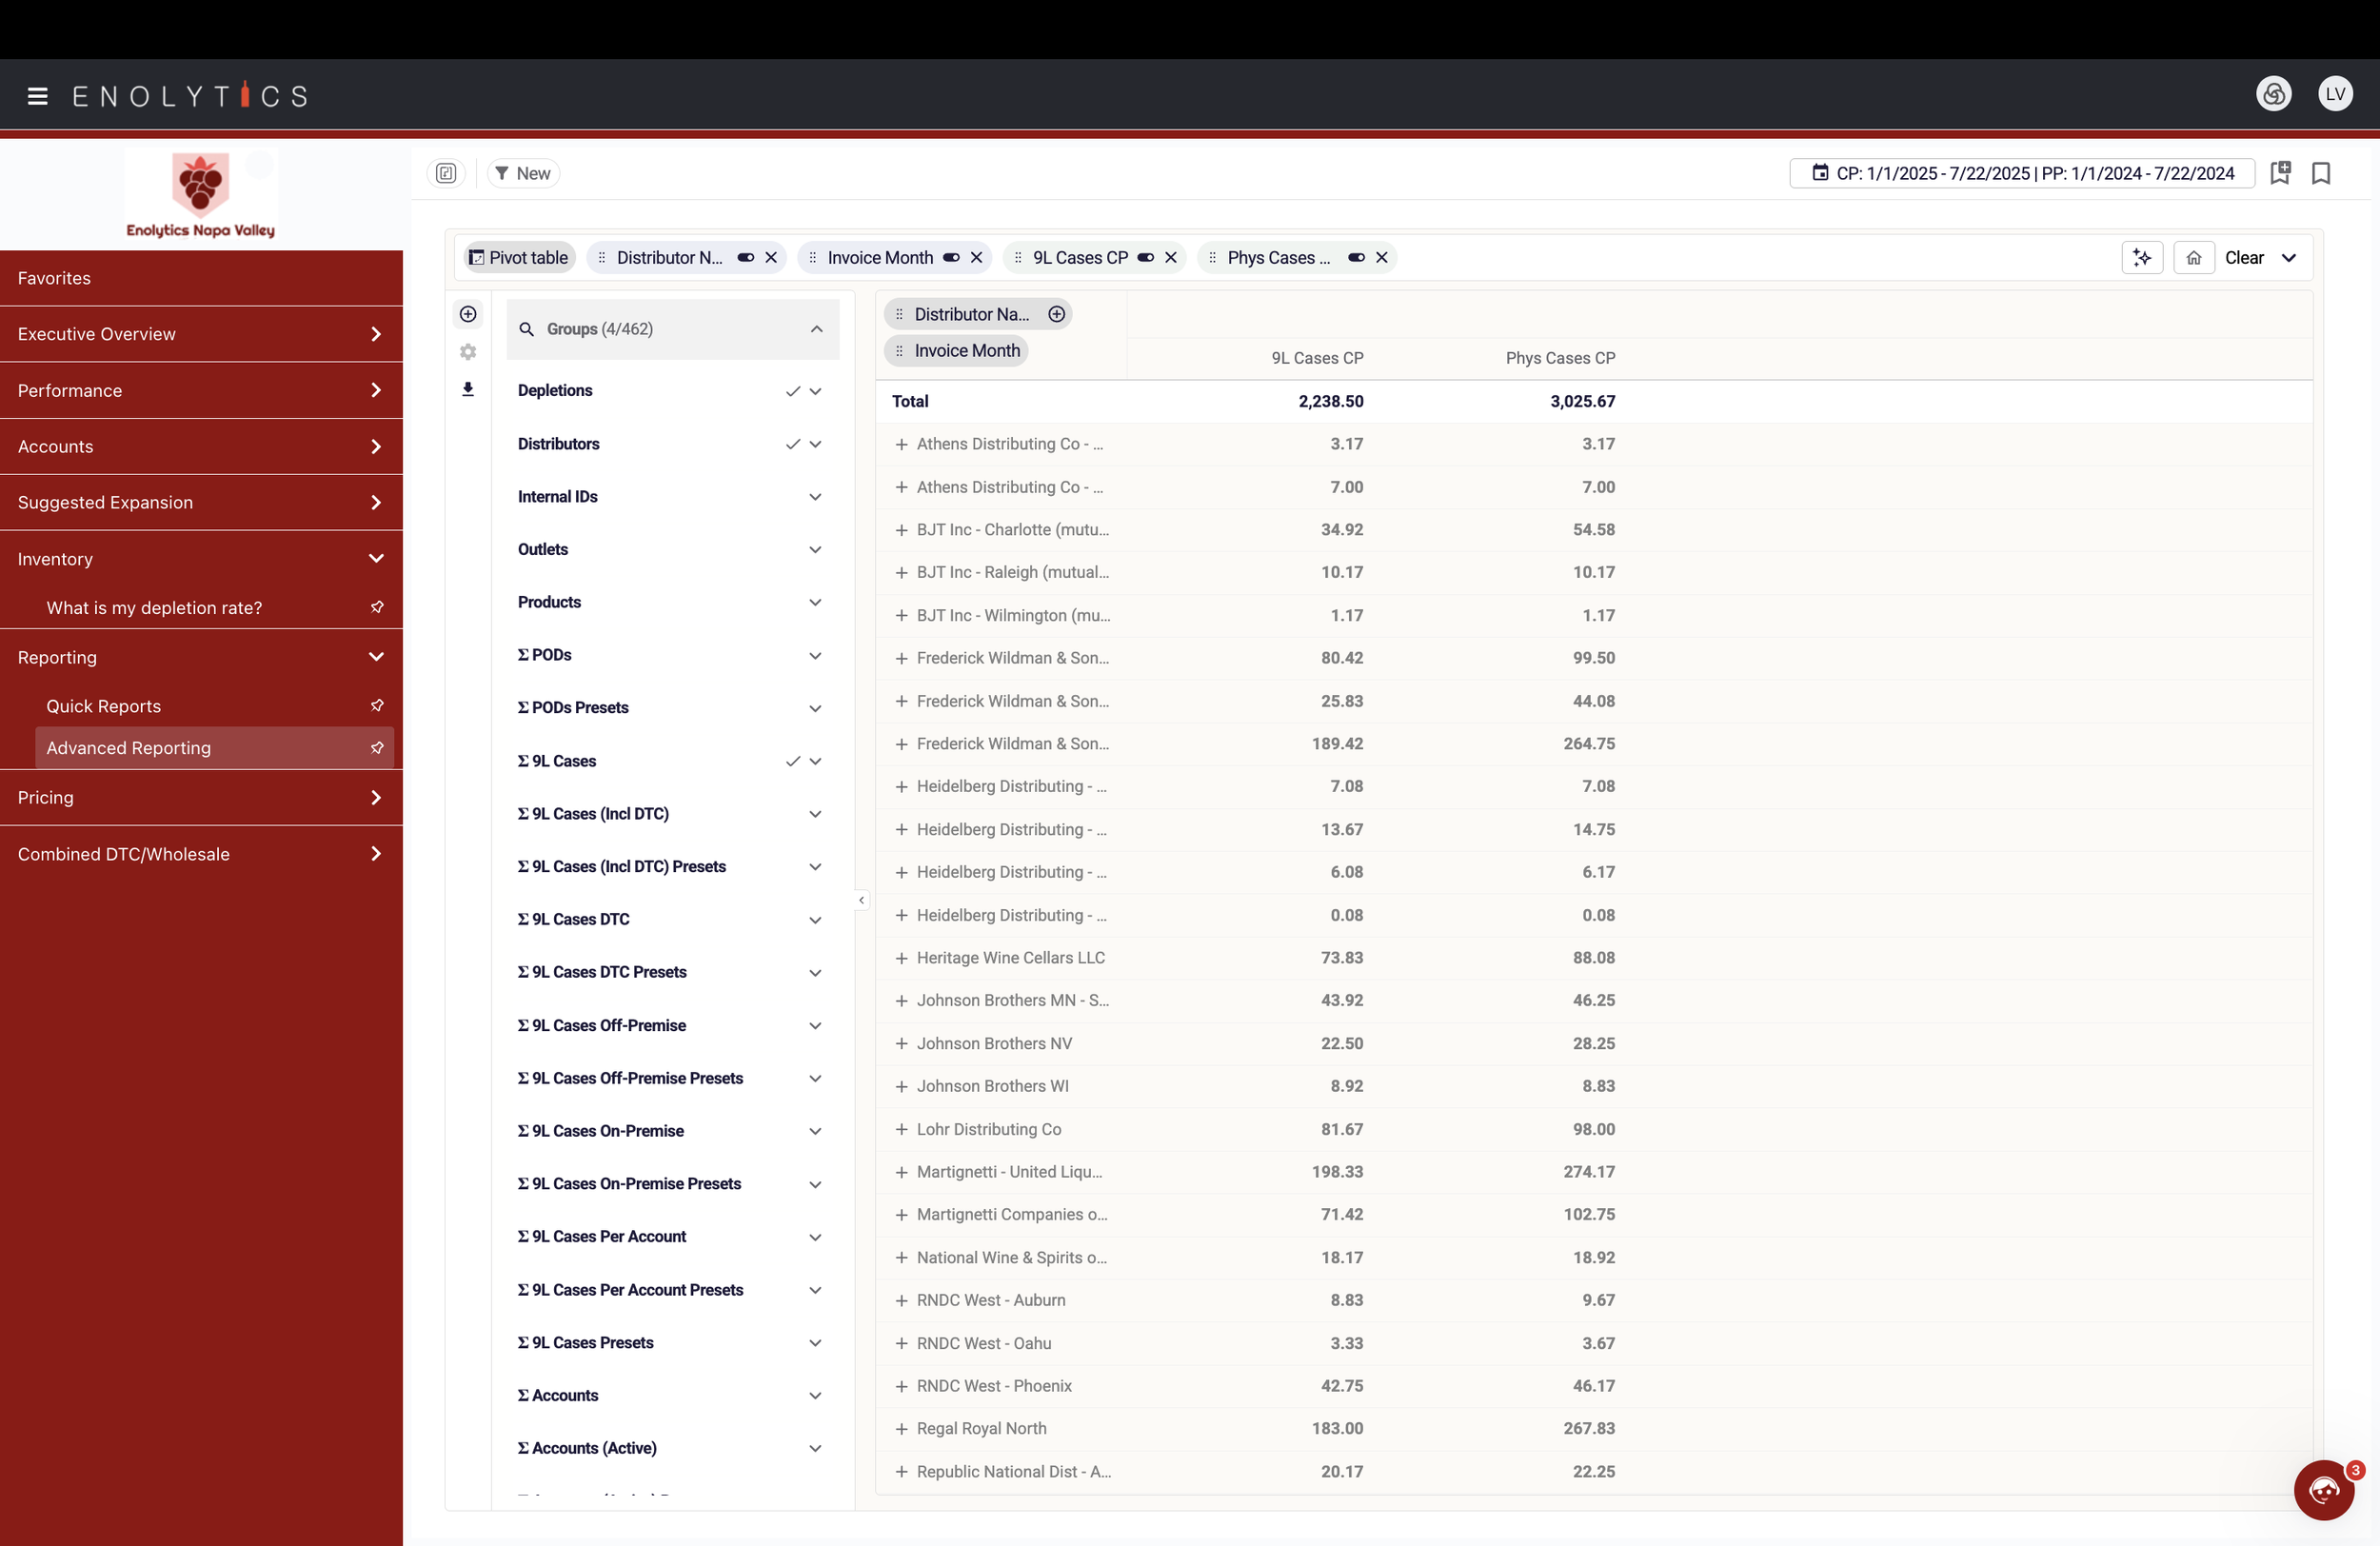
Reporting
Very robust report creation tool that enables you to create any report you need, visualized in a variety of formats, within minutes.
User-generated report interface empowers you to customize the mix of Dimensions and Measures, according to the information you need to know.
Bookmark feature enables you to "Save" a report you'll need again and again. The data will refresh with the most recent data, each time you open the report.
-
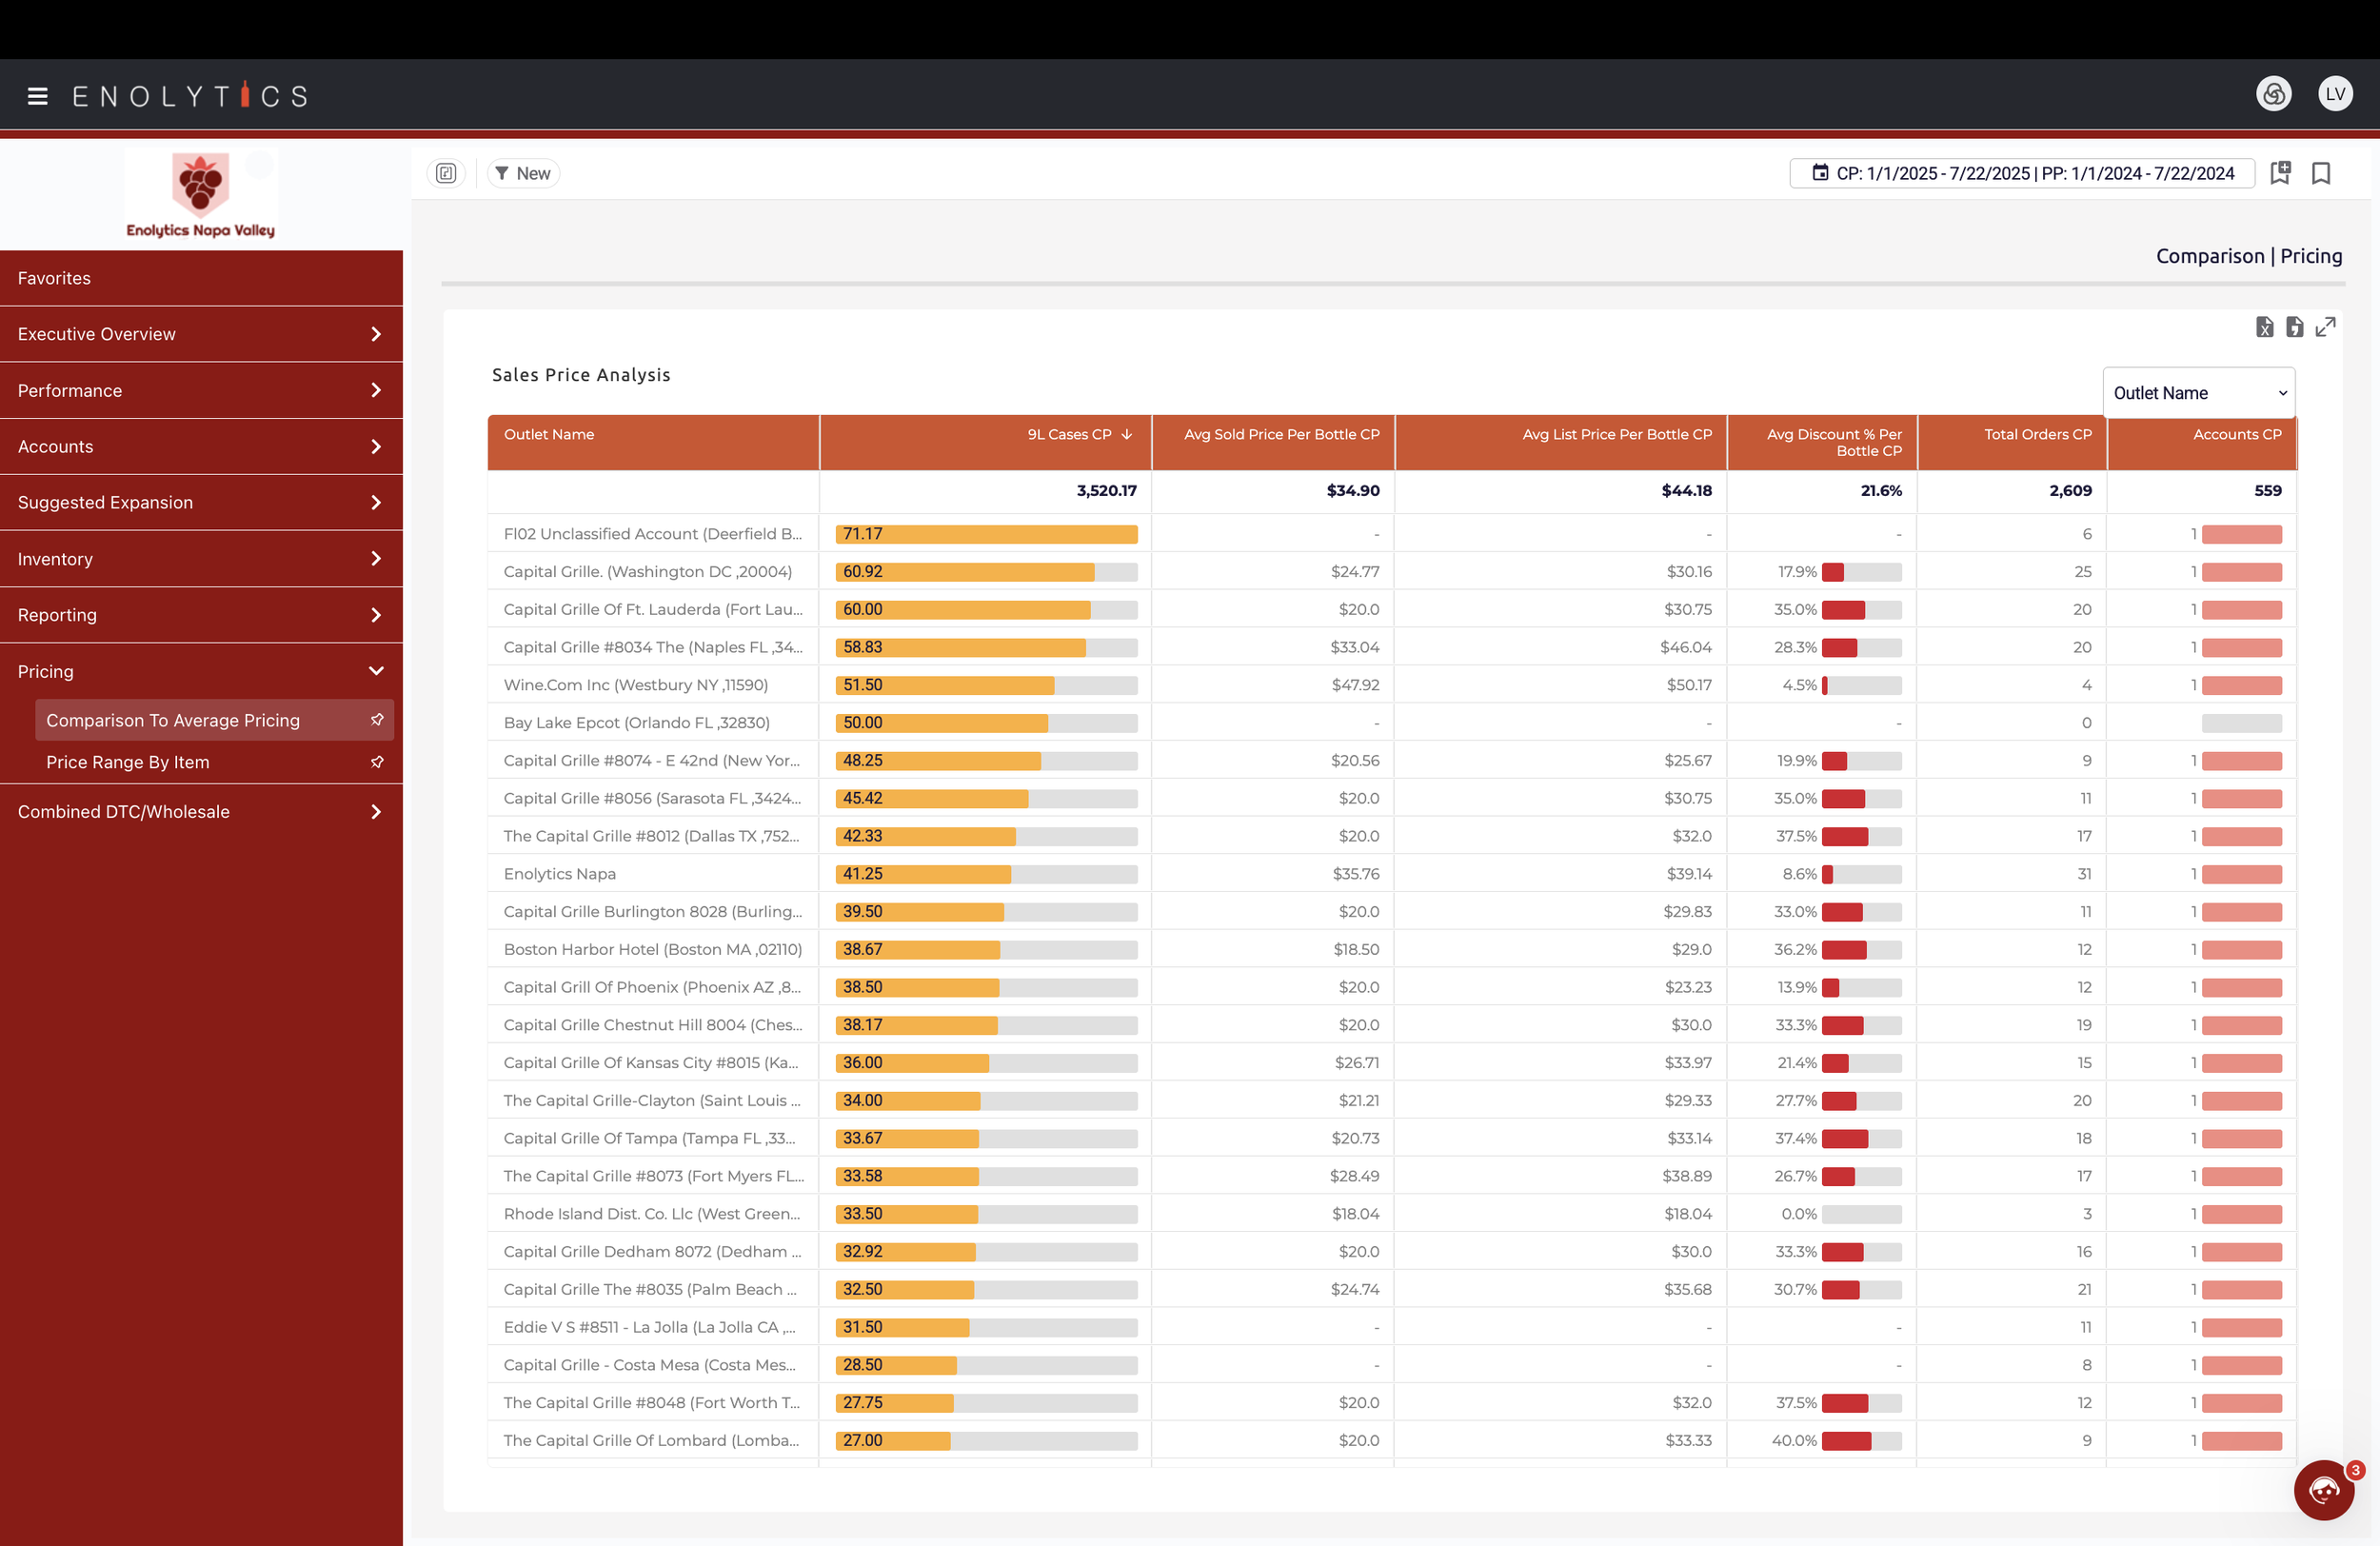
Pricing
Compare FOB pricing across any dimension including account, distributor, market and item
Understand your price distribution by SKU across price points
View a scatter graph is pricing by SKU across pricing bands
-
Combined DTC/Wholesale
View combined DTC and Wholesale cases sold by channel and month
Gain a complete picture of cases sold by SKU and DTC/Wholesale channels
