
What Makes Enolytics Different from Any Other Reporting Platform?
What makes Enolytics different from any other reporting platform?
It’s a fair enough question, and we’re always glad to respond.
Lately we’ve been starting with this graphic, of what’s above and below the surface when it comes to wine data.
It’s like an iceberg in the ocean.
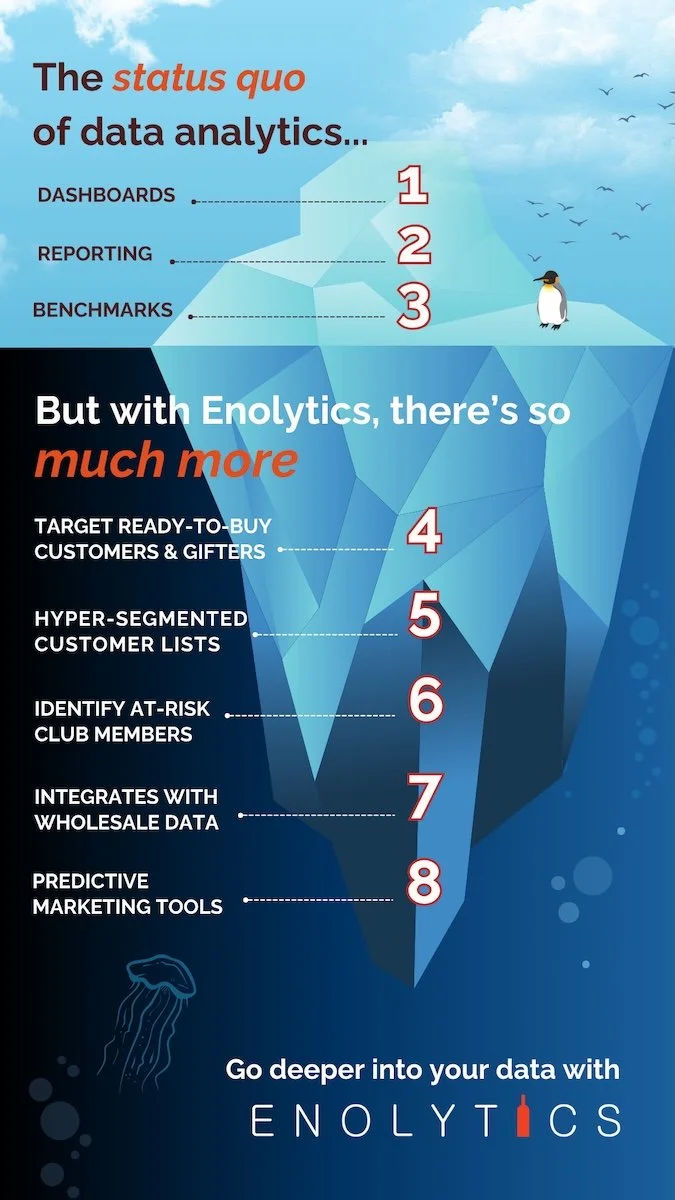
The “tip of the iceberg,” above the surface of the water, is what most wineries see and use when it comes to data: dashboards, reporting, and benchmarking. But these elements, while essential, merely scratch the surface of what data can reveal about a wine business’ health and growth.
Those things report, yes, but on sales that have already happened in the past.
Notice the penguin at the top of the graphic! Which is appropriate enough: they’re comfortable and familiar there, but hardly adventurous or trail-blazing.
It’s what lies beneath the surface — the deeper insights — that are vast and transformative.
Growth-oriented, and forward-looking. Proactive, not reactive.
They’re what turn raw data into real revenue: things like hyper-segmentation, integrating data streams, and harnessing predictive intelligence and marketing tools.
Data isn’t static; it empowers marketers and owners to anticipate outcomes, not just assess them in hindsight. It helps us make smarter decisions, faster.
Like the ocean itself, data is alive, dynamic, and waiting to be explored. Many wineries still swim on the surface.
The real opportunity—and competitive edge—comes to those willing to “go deeper.”
Every numbered item below the waterline in the graphic is an invitation to look past the obvious, to challenge assumptions, and to unlock value that is often hidden.
We could all use a lot more of that right now.
Drop me a note, and let’s go below the surface together.
Thank you, as always, for reading —
Cathy